. 2007;35(2):371-89.
doi: 10.1093/nar/gkl1050. Epub 2006 Dec 14.

Modulating role of RNA structure in alternative splicing of a critical exon in the spinal muscular atrophy genes

Affiliations

Modulating role of RNA structure in alternative splicing of a critical exon in the spinal muscular atrophy genes

Natalia N Singh et al. Nucleic Acids Res. 2007.

Abstract

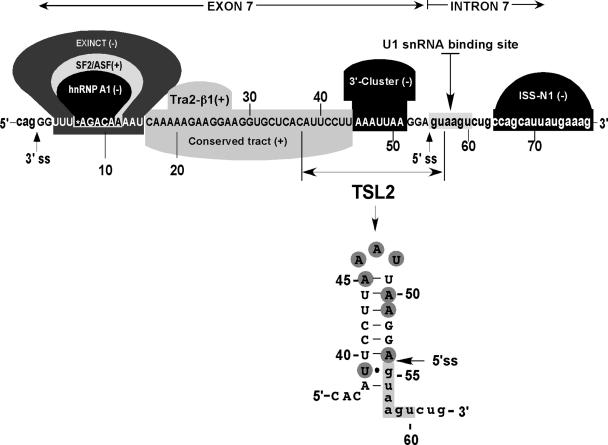
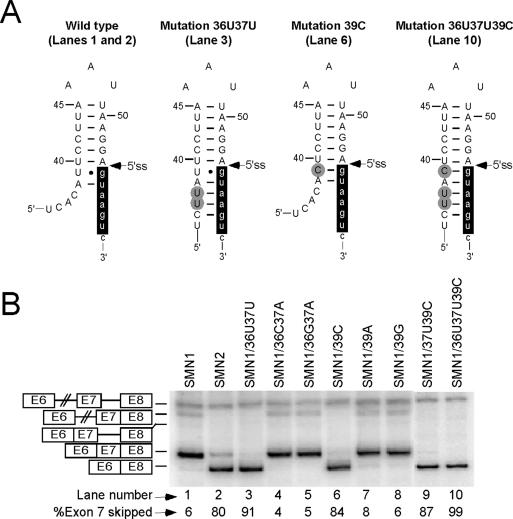
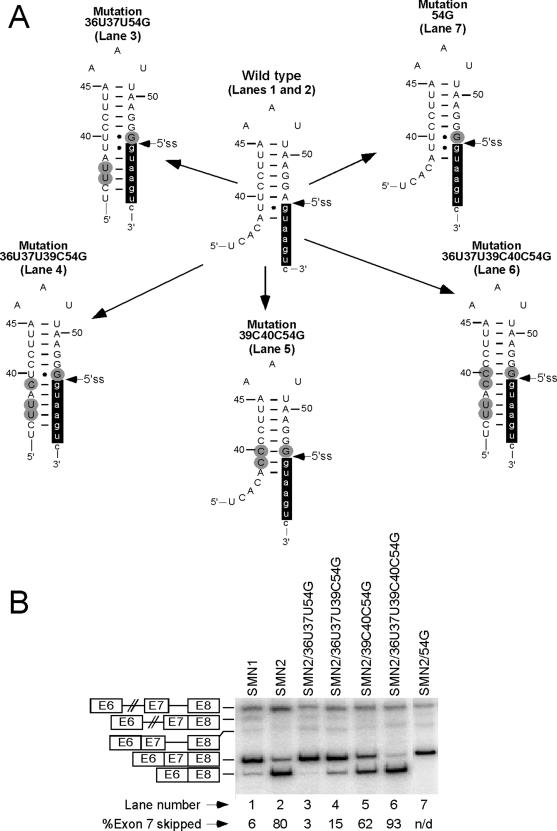
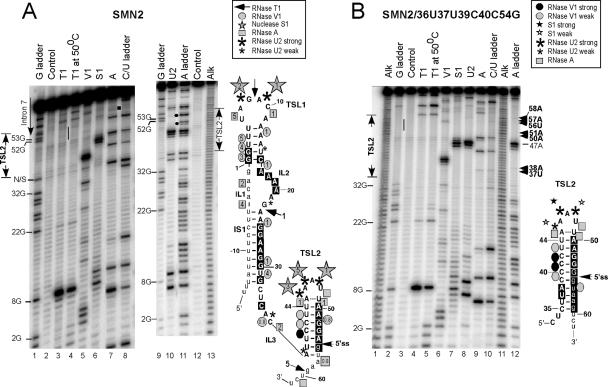
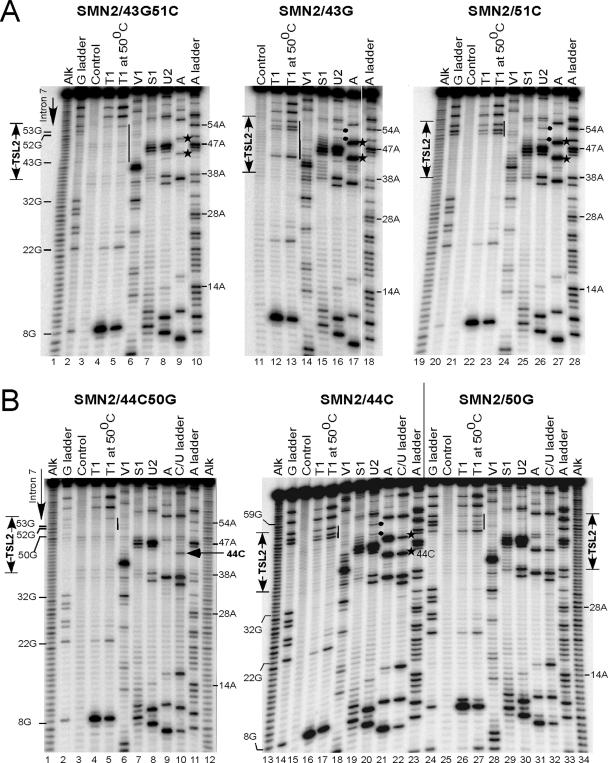
Humans have two nearly identical copies of the survival motor neuron (SMN ) gene, SMN1 and SMN2. Homozygous loss of SMN1 causes spinal muscular atrophy (SMA). SMN2 is unable to prevent the disease due to skipping of exon 7. Using a systematic approach of in vivo selection, we have previously demonstrated that a weak 5' splice site (ss) serves as the major cause of skipping of SMN2 exon 7. Here we show the inhibitory impact of RNA structure on the weak 5' ss of exon 7. We call this structure terminal stem-loop 2 (TSL2). Confirming the inhibitory nature of TSL2, point mutations that destabilize TSL2 promote exon 7 inclusion in SMN2, whereas strengthening of TSL2 promotes exon 7 skipping even in SMN1. We also demonstrate that TSL2 negatively affects the recruitment of U1snRNP at the 5' ss of exon 7. Using enzymatic structure probing, we confirm that the sequence at the junction of exon 7/intron 7 folds into TSL2 and show that mutations in TSL2 cause predicted structural changes in this region. Our findings reveal for the first time the critical role of RNA structure in regulation of alternative splicing of human SMN.


Figures

Figure 1
Figure 1
Diagrammatic representation of exon 7 and adjacent intronic sequences. Capital letters represent exonic and small-case letters represent intronic nucleotides. Numbering starts from the first position of exon 7. The U1 snRNA binding site is indicated along with positive (+) and negative (−) cis-elements, which promote and inhibit exon 7 inclusion, respectively. Exinct, Conserved tract and 3′-Cluster were discovered by in vivo selection of the entire exon 7 (53). Binding sites for splicing factors SF/ASF2, hnRNP A1 and Tra2β have been described by others (49,50,54). ISS-N1 is a novel element we identified recently (60). Nucleotides involved in the formation of terminal stem–loop structure TSL2 are indicated. Based on the results of in vivo selection of the entire exon 7 (53), highly mutable nucleotides (shaded) are clustered within TSL2.
Figure 2
Figure 2
Effect of stem strengthening on splicing of SMN1 exon 7. (A) Mutations and their effect on the predicted TSL2 structure. Numbers and letters in each mutation's name represent the positions and types of substitutions within exon 7. Capital and small-case letters are used to indicate nucleotides of exon 7 and intron 7, respectively. Nucleotide numbering is the same as in Figure 1. Mutations are highlighted in gray. Nucleotides involved in base paring with U1 snRNA are highlighted in black. Canonical Watson–Crick base pairing and Wobble base pairing are indicated by continuous lines and filled circles, respectively. (B) In vivo splicing patterns of SMN1 mutants. Numbers and letters in each mutant's name represent the positions and the types of substitution within exon 7. Precursor mRNA, intron 7- and intron 6-retained splicing intermediates as well as exon 7-included and exon 7-skipped spliced products are indicated on the left. Abbreviations E6, E7 and E8 stand for exon 6, exon 7 and exon 8, respectively. Percentage of exon 7 skipping was calculated from the total value of exon 7-included and exon 7-skipped products.
Figure 3
Figure 3
Effect of U1 snRNA base pairing on splicing of SMN1 mutants with strengthened TSL2. (A) Diagrammatic representation of base pairing formed between the 5′ ss of exon 7 and wild-type or mutant U1 snRNA. The last 6 nt of exon 7 are indicated by capital letters, while the first 8 nt of intron 7 are indicated by small-case letters. Numbering starts from the first position of exon 7. Mutations within U1 snRNA are highlighted in black. (B) In vivo splicing patterns of SMN1 mutants shown in Figure 2A in the presence of either wild-type or mutant U1 snRNA. Spliced intermediates and products are the same as indicated in Figure 2B.
Figure 4
Figure 4
Effect of 54G on splicing of exon 7 mutants with strengthened TSL2. (A) Effect of mutations on the predicted TSL2 structure. All mutations were made in SMN2. Numbers and letters in each mutation's name represent the positions and types of substitutions within exon 7. Numbering starts from the first position of exon 7. Capital and small-case letters indicate nucleotides of exon 7 and intron 7, respectively. Mutations, including 54G, are highlighted in gray. Nucleotides involved in base paring with U1 snRNA are highlighted in black. Canonical Watson–Crick base pairing and Wobble base pairing are indicated by continuous lines and filled circles, respectively. (B) In vivo splicing patterns of SMN2 mutants shown in (A). Spliced intermediates and products are the same as indicated in Figure 2B. N/D stands for not detectable.
Figure 5
Figure 5
Effect of loop mutations on exon 7 splicing. (A) In vivo splicing pattern of SMN2 mutants harboring point mutations within the loop portion of TSL2. Numbers and letters represent the positions and the types of substitution within exon 7. Splicing products are the same as in Figure 2B. ‘Cry’ refers to the cryptic splice site. (B) In vivo splicing pattern of SMN2 mutants in which the wild-type triloop was substituted with longer loops. Loop sequences are shown in the upper panel, where capital and small-case letters indicate nucleotides in the 5′-/3′-portion of the stem and the loop region, respectively. W.T. stands for wild-type. Splicing products are the same as in Figure 2B. (C) In vivo splicing pattern of SMN1 mutants harboring stable tetraloops. Splicing products are the same as in Figure 2B. Capital letters indicate loop sequnces, while small-case letters indicate nucleotides that form a closing base pair.
Figure 6
Figure 6
Effect of site-specific mutations on SMN2 exon 7 splicing. (A) Schematic representation of the predicted TSL2. Capital and small-case letters indicate nucleotides of exon 7 and intron 7, respectively. Numbering starts from the first position of exon 7. Nucleotides involved in base paring with U1 snRNA are highlighted in black. Mutations at indicated positions and their effect on structure are shown. Numbers and letters represent the positions and the types of substitution within exon 7. The lack of base pairing, canonical Watson–Crick base pairing and Wobble base pairing are indicated by dots, continuous lines and filled circles, respectively. (B) In vivo splicing pattern of SMN2 mutants harboring mutations shown in (A). Splicing products are the same as in Figure 2B. N/D stands for not detectable.
Figure 7
Figure 7
RNA secondary structure of exon 7 probed by partial enzymatic cleavage. (A) RNA structure probing of wild-type SMN2 exon 7. The 5′ end-labeled RNA was subjected to partial cleavage using the indicated enzymes followed by separation on denaturing 8% polyacrylamide gels. An alkaline hydrolysis ladder (alk) is included together with a partial RNase T1 (G ladder), RNase A (C/U ladder) and RNase U2 (A ladder) digestions under denaturing conditions. Positions corresponding to intron 7 and TSL2 are indicated. A bar indicates the lack of RNase T1 cuts at 52G, 53G and 55G. Filled circles indicate the lack of RNase U2 cuts at positions 50A, 51A and 54A. A square indicates 60U residue. Structure probing results were superimposed on the mfold predicted secondary structure of exon 7 shown on the right. Nucleotide numbers and the 5′ ss are marked. Numbering starts from the first position of exon 7. Structural elements are indicated as in (62). Employed symbols are shown in the insert. Relative susceptibilities of sites to nuclease S1, RNase T1, V1 and A are indicated by numbers. These numbers were generated by quantifying cleavage profiles and assigning an intensity of five to the highest peak; the remaining peaks were scaled accordingly. Since the intensities of 8G and 40U band (in T1 and V1 digestion, respectively) were very high compared to other bands, these sites were not included in quantifications. The bands located right next to 40U were obscured and, therefore, their intensity could not be quantified. Nucleotides protected from RNAses T1, A and U2 are shaded in black. A residue was considered to be protected if the corresponding band was present in denatured but absent or substantially weaker in folded RNA. All quantifications were corrected for the background represented by a control lane. N/S stands for non-specific. (B) RNA secondary structure probing of mutant SMN2/36U37U39C40C54G. RNA preparation and labeling details are the same as in (A). TSL2 region is indicated. Structure probing results were superimposed on the predicted TSL2 structure shown on the right. Employed symbols are shown in the insert. Nucleotides protected from RNAses T1, RNase A and RNase U2 are shaded in black. A residue was considered to be protected if the corresponding band was present in denatured but absent or substantially weaker in folded RNA.
Figure 8
Figure 8
Analysis of TSL2 secondary structure in SMN2 mutants. (A) RNA secondary structure probing for mutants SMN2/43G51C, SMN2/43G and SMN2/51C. Note that single substitutions are predicted to destabilize TSL2 stem, while double substitutions are predicted to restore the stem. The 5′ end-labeled RNAs were subjected to partial cleavage using the indicated enzymes followed by separation on denaturing 8% polyacrylamide gels. An alkaline hydrolysis ladder (alk) as well as RNase T1 (G ladder), RNase A (C/U ladder) and RNase U2 (A ladder) digestion patterns under denaturing conditions are included. TSL2 region is indicated. Solid bars represent the absence or presence of T1 cleavage at G residues located in TSL2 area. Stars indicate RNase A cleavage at 44U and 49U residues. Filled circles mark RNase U2 cuts at 52A and 54A. (B) RNA secondary structure of mutants SMN2/44C50G, SMN2/44C and SMN2/50G. RNA preparation and other details are the same as in (A). The arrow marks RNase A cut that corresponds to 44C residue.

References

    1. Black D.L. Mechanisms of alternative pre-messenger RNA splicing. Annu. Rev. Biochem. 2003;72:291–336. - PubMed
    1. Rothrock C., Cannon B., Hahm B., Lynch K.W. A conserved signal-responsive sequence mediates activation-induced alternative splicing of CD45. Mol. Cell. 2003;12:1317–1324. - PubMed
    1. Matlin A.J., Clark F., Smith C.W.J. Understanding alternative splicing: towards a cellular code. Nature Rev. Mol. Cell. Biol. 2005;6:386–398. - PubMed
    1. Maniatis T., Tasic B. Alternative pre-mRNA splicing and proteome expansion in metazoans. Nature. 2002;418:236–243. - PubMed
    1. Nilsen T.W. The spliceosome: the most complex macromolecular machine in the cell? Bioessays. 2003;25:1147–1149. - PubMed

Publication types

MeSH terms