

Impairments in frontal cortical gamma synchrony and cognitive control in schizophrenia
- PMID: 17170134
- PMCID: PMC1750867
- DOI: 10.1073/pnas.0609440103
Impairments in frontal cortical gamma synchrony and cognitive control in schizophrenia
Abstract
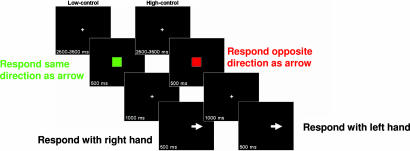
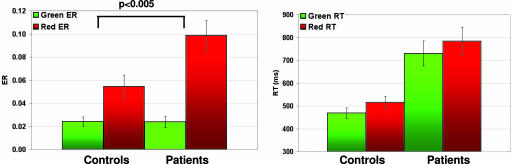
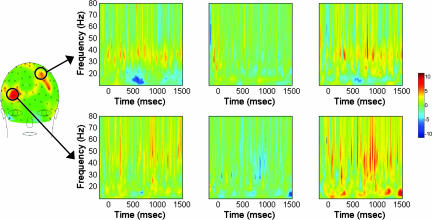
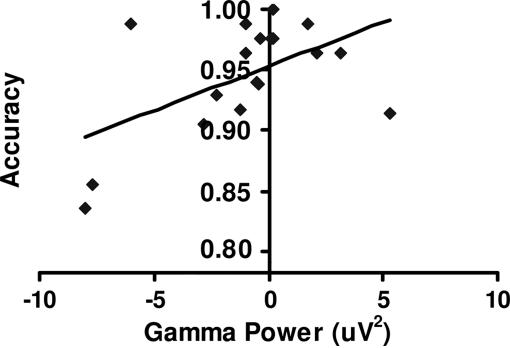
A critical component of cognitive impairments in schizophrenia can be characterized as a disturbance in cognitive control, or the ability to guide and adjust cognitive processes and behavior flexibly in accordance with one's intentions and goals. Cognitive control impairments in schizophrenia are consistently linked to specific disturbances in prefrontal cortical functioning, but the underlying neurophysiologic mechanisms are not yet well characterized. Synchronous gamma-band oscillations have been associated with a wide range of perceptual and cognitive processes, raising the possibility that they may also help entrain prefrontal cortical circuits in the service of cognitive control processes. In the present study, we measured induced gamma-band activity during a task that reliably engages cognitive control processes in association with prefrontal cortical activations in imaging studies. We found that higher cognitive control demands were associated with increases in induced gamma-band activity in the prefrontal areas of healthy subjects but that control-related modulation of prefrontal gamma-band activity was absent in schizophrenia subjects. Disturbances in gamma-band activity in patients correlated with illness symptoms, and gamma-band activity correlated positively with performance in control subjects but not in schizophrenia patients. Our findings may provide a link between previously reported postmortem abnormalities in thalamofrontocortical circuitry and alterations in prefrontal activity observed in functional neuroimaging studies. They also suggest that deficits in frontal cortical gamma-band synchrony may contribute to the cognitive control impairments in schizophrenia.
Conflict of interest statement
The authors declare no conflict of interest.
Figures
References
-
- Green MF. Am J Psychiatry. 1996;153:321–330. - PubMed
-
- Kerns JG, Cohen JD, MacDonald AW, III, Cho RY, Stenger VA, Carter CS. Science. 2004;303:1023–1026. - PubMed
-
- MacDonald AW, III, Cohen JD, Stenger VA, Carter CS. Science. 2000;288:1835–1838. - PubMed
-
- Miller EK, Cohen JD. Annu Rev Neurosci. 2001;24:167–202. - PubMed
-
- Barch DM, Carter CS, Braver TS, Sabb FW, MacDonald A, III, Noll DC, Cohen JD. Arch Gen Psychiatry. 2001;58:280–288. - PubMed
Publication types
MeSH terms
Grants and funding
LinkOut - more resources
Full Text Sources
Other Literature Sources
Medical
Molecular Biology Databases
