. 2007 Mar 15;92(6):2041-53.
doi: 10.1529/biophysj.106.090266. Epub 2006 Dec 15.

High apparent dielectric constant inside a protein reflects structural reorganization coupled to the ionization of an internal Asp

Affiliations

High apparent dielectric constant inside a protein reflects structural reorganization coupled to the ionization of an internal Asp

Daniel A Karp et al. Biophys J. .

Abstract

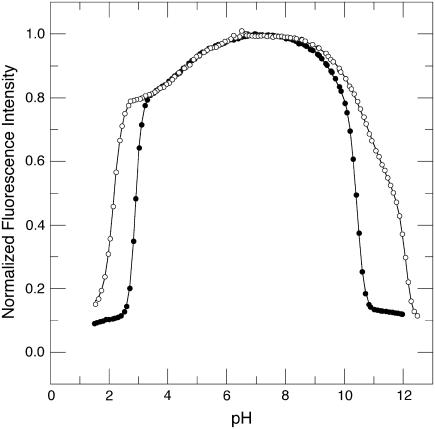
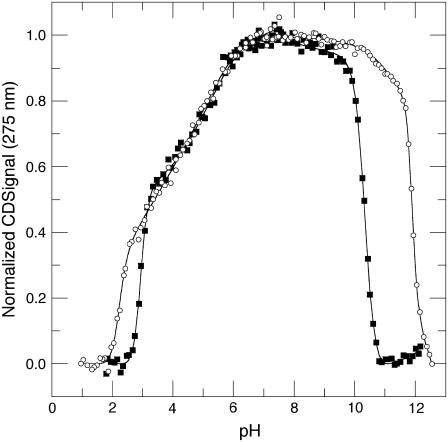
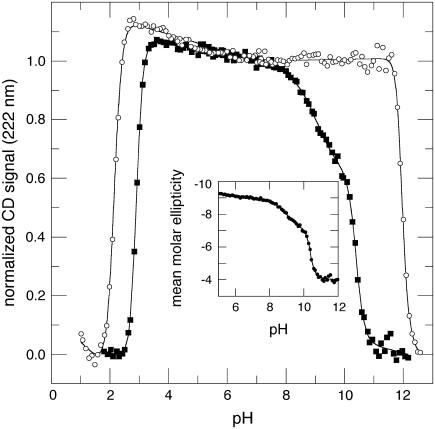
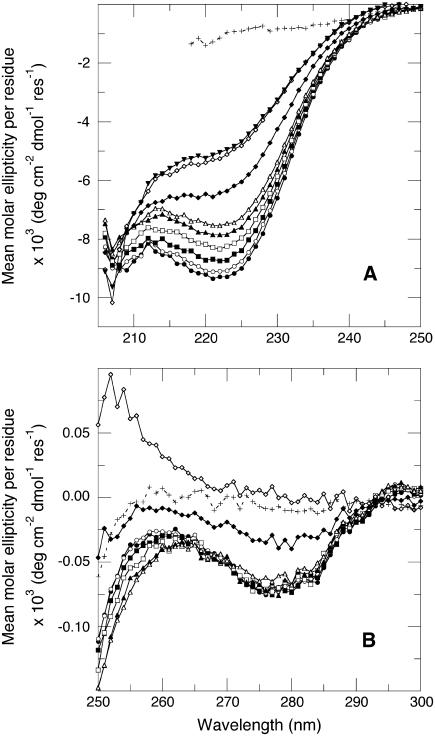
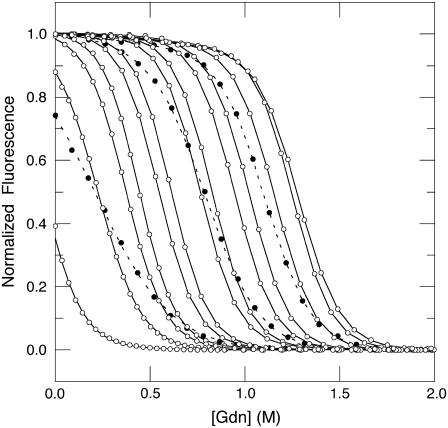
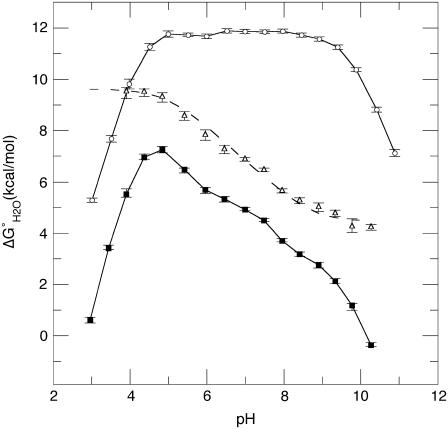
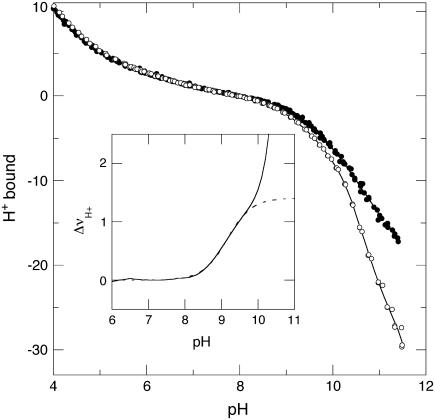
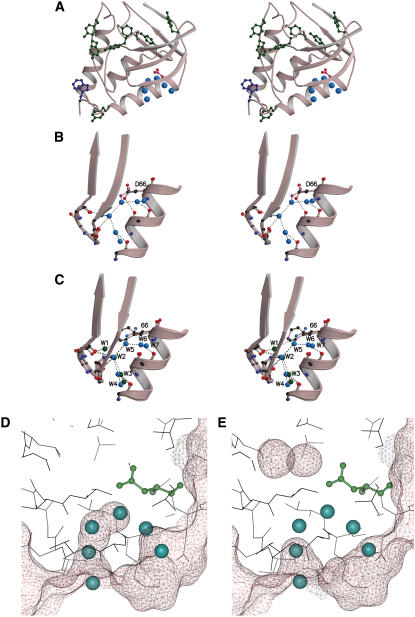
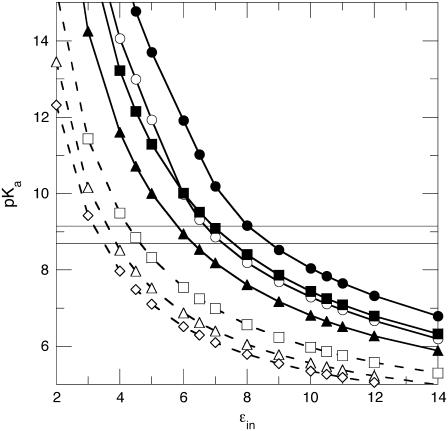
The dielectric properties of proteins are poorly understood and difficult to describe quantitatively. This limits the accuracy of methods for structure-based calculation of electrostatic energies and pK(a) values. The pK(a) values of many internal groups report apparent protein dielectric constants of 10 or higher. These values are substantially higher than the dielectric constants of 2-4 measured experimentally with dry proteins. The structural origins of these high apparent dielectric constants are not well understood. Here we report on structural and equilibrium thermodynamic studies of the effects of pH on the V66D variant of staphylococcal nuclease. In a crystal structure of this protein the neutral side chain of Asp-66 is buried in the hydrophobic core of the protein and hydrated by internal water molecules. Asp-66 titrates with a pK(a) value near 9. A decrease in the far UV-CD signal was observed, concomitant with ionization of this aspartic acid, and consistent with the loss of 1.5 turns of alpha-helix. These data suggest that the protein dielectric constant needed to reproduce the pK(a) value of Asp-66 with continuum electrostatics calculations is high because the dielectric constant has to capture, implicitly, the energetic consequences of the structural reorganization that are not treated explicitly in continuum calculations with static structures.


Figures

FIGURE 1
FIGURE 1
Acid/base titration of Δ+PHS (○) and Δ+PHS/V66D (•) monitored by changes in the intrinsic fluorescence of Trp-140. The line represents the fit of Eq. 1 or 2 to the data. All measurements at 298 K in 25 mM buffer, 100 mM KCl.
FIGURE 2
FIGURE 2
Acid/base titration of Δ+PHS (○) and Δ+PHS/V66D (▪) monitored by near UV-CD signal measured at 275 nm. The line represents the fit of Eq. 1 or 2 to the data. All measurements at 298 K in 25 mM buffer, 100 mM KCl.
FIGURE 3
FIGURE 3
Acid/base titration of Δ+PHS (○) and Δ+PHS/V66D (▪) monitored by far UV-CD signal measured at 222 nm. The line represents the fit of Eq. 1 or 2 to the data. The inset shows the data for Δ+PHS/V66D represented as mean molar ellipticity per residue × 103 (deg cm−2 dmol−1 res−1). All measurements at 298 K in 25 mM buffer, 100 mM KCl.
FIGURE 4
FIGURE 4
pH dependence of the mean molar ellipticity per residue of Δ+PHS/V66D (A) in the far UV-CD region and (B) in the near UV-CD region. The lines are only meant to guide the eye. The spectra were collected at pH 6.55 (•), 7.85 (○), 8.58 (▪), 9.01 (□), 9.43 (▴), 9.93 (▵), 10.36 (♦), 10.86 (⋄), and 11.35 (▾) (note that this last pH is not shown in B). Also included for reference is the signal measured at pH 7 in 7 M GdnHCl (+++++). All measurements at 298 K, 25 mM KCl.
FIGURE 5
FIGURE 5
GdnHCl titrations of Δ+PHS/V66D monitored by intrinsic fluorescence. Solid lines and open circles identify data from pH 10.5 to 4.5 in steps of 0.5 pH units (left to right). Dashed lines and solid circles refer to data from pH 3 to pH 4 (left to right). The lines represent fits to a two-state model of reversible denaturation. All measurements at 298 K, 100 mM KCl.
FIGURE 6
FIGURE 6
pH dependence of stability (formula image) measured by GdnHCl denaturation monitored by changes in intrinsic fluorescence for Δ+PHS (○) and Δ+PHS/V66D (▪) at 298 K in 100 mM KCl. The error bars shown are the errors of the fit for the individual denaturation experiments. Also shown is the difference in stability (formula image) between these two proteins (▵), shifted arbitrarily along the ordinate for display purposes. The dashed line through formula image is the fit with Eq. 3.
FIGURE 7
FIGURE 7
Potentiometric H+ titration of Δ+PHS (•) and Δ+PHS/V66D (○) at 298 K in 100 mM KCl. The solid lines through the experimental data represent fits with linear interpolation. The solid line in the inset shows the difference between the interpolated curves for these two proteins, and the dotted line represents the fit with Eq. 4 with the amplitude of the titration fixed at 1.
FIGURE 8
FIGURE 8
(A) Stereo representation of the crystallographic structure of PHS/V66D obtained at 100 K. The side chain of Asp-66 is shown in red and the site-bound water molecules near Asp-66 are represented as light-blue spheres. The Trp-140 responsible for the intrinsic fluorescence in the neutral range of pH is shown in blue, and the Tyr residues that might contribute to the pH dependence of fluorescence at high pH are shown in green. (B) Stereo representation of a closeup of the network of hydrogen bonds between the backbone, the side chain of Asp-66, and the five structural water molecules nearest to it. The side chain of Asp-66 in the 100 K structure (purple oxygen atoms) and in the room-temperature structure (red oxygen atoms) are shown. (C) Superposition of structures with Glu, Lys, and Asp at position 66 to compare the conformation of this side chain. The ionizable moieties are color-coded: Lys (purple), Glu (green), and Asp (blue). Water molecules from the structure with Asp-66 are shown as blue spheres. The green spheres identify the waters seen in the structure with Glu-66. Connelly-surface calculated for the 100 K structure (D) and for the room temperature (E) structures with a probe of 1.4 Å. The water molecules observed in the 100 K are shown in the room-temperature structure for purposes of comparison.
FIGURE 9
FIGURE 9
pKa values calculated with the finite-difference Poisson-Boltzmann continuum method as a function of the protein dielectric constant (ɛin) with (dashed line) or without (solid line) explicit treatment of the internal water molecules observed in the structure obtained at 100 K. The horizontal lines describe the range of pKa values measured experimentally for Asp-66. The different calculations described by these data are: (•) all energy terms, room-temperature structure; (○) all energy terms, 100 K structure; (▪) Born term only, room-temperature structure; (▴) self-energy term (Born and background) only, room-temperature structure; (□) self-energy term only, 100 K structure, W5 included explicitly; (▵) self-energy term only, low temperature structure, W5 and W6 included explicitly; and (⋄) self-energy term only, low-temperature structure, W2, W3, W5, and W6 included explicitly.

References

    1. Fitch, C. A., D. A. Karp, K. K. Lee, W. E. Stites, E. E. Lattman, and B. García-Moreno E. 2002. Experimental pKa values of buried residues: analysis with continuum methods and role of water penetration. Biophys. J. 82:3289–3304. - PMC - PubMed
    1. Schutz, C. N., and A. Warshel. 2001. What are the dielectric “constants” of proteins and how to validate electrostatic models? Proteins Struct. Funct. Gen. 44:400–417. - PubMed
    1. Dwyer, J., A. Gittis, D. A. Karp, E. E. Lattman, D. Spencer, W. Stites, and B. García-Moreno E. 2000. High apparent dielectric constants in the interior of a protein reflect water penetration. Biophys. J. 79:1610–1620. - PMC - PubMed
    1. García-Moreno E., B., J. Dwyer, A. Gittis, E. E. Lattman, D. Spencer, and W. Stites. 1997. Experimental measurement of the effective dielectric in the hydrophobic core of a protein. Biophys. Chem. 64:211–224. - PubMed
    1. Dao-pin, S., D. E. Anderson, W. A. Baase, F. W. Dahlquist, and B. W. Matthews. 1991. Structural and thermodynamic consequences of burying a charged residue within the hydrophobic core of T4 lysozyme. Biochemistry. 30:11521–11529. - PubMed

Publication types