. 2007 Mar 1;92(5):1792-805.
doi: 10.1529/biophysj.106.093138. Epub 2006 Dec 15.

Thermodynamics-based metabolic flux analysis

Affiliations

Thermodynamics-based metabolic flux analysis

Christopher S Henry et al. Biophys J. .

Abstract

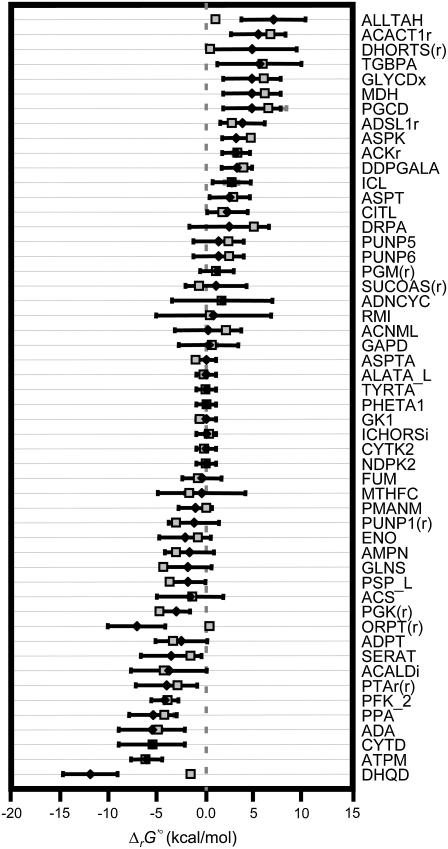
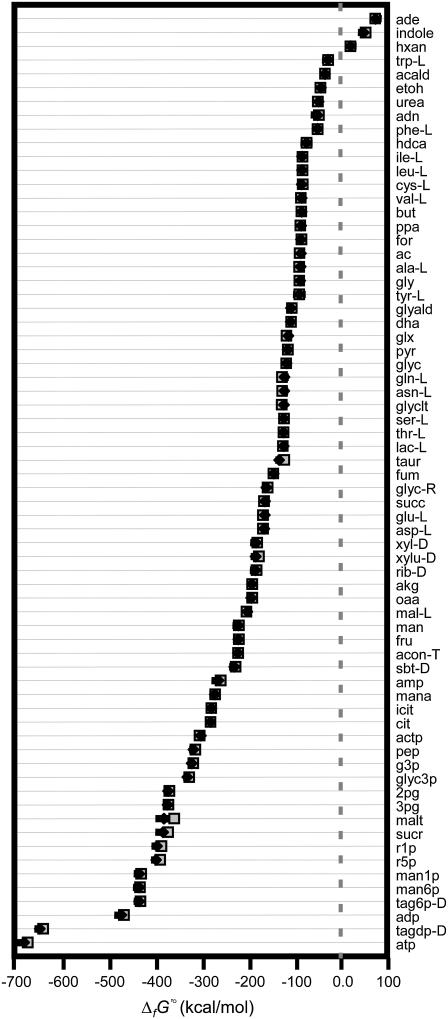
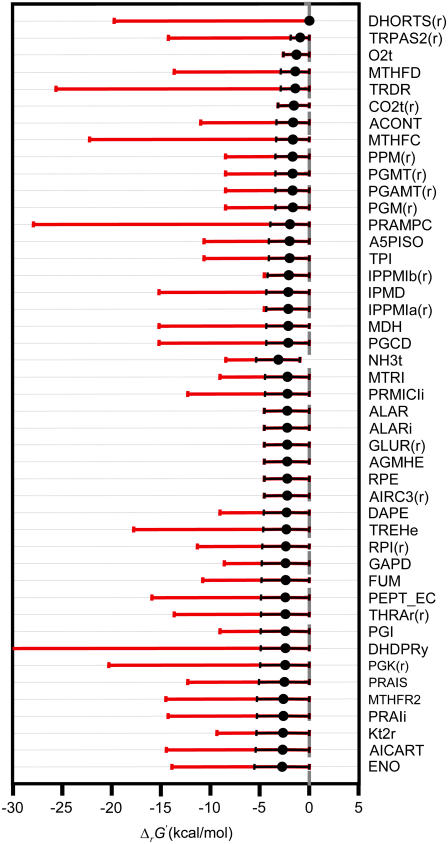
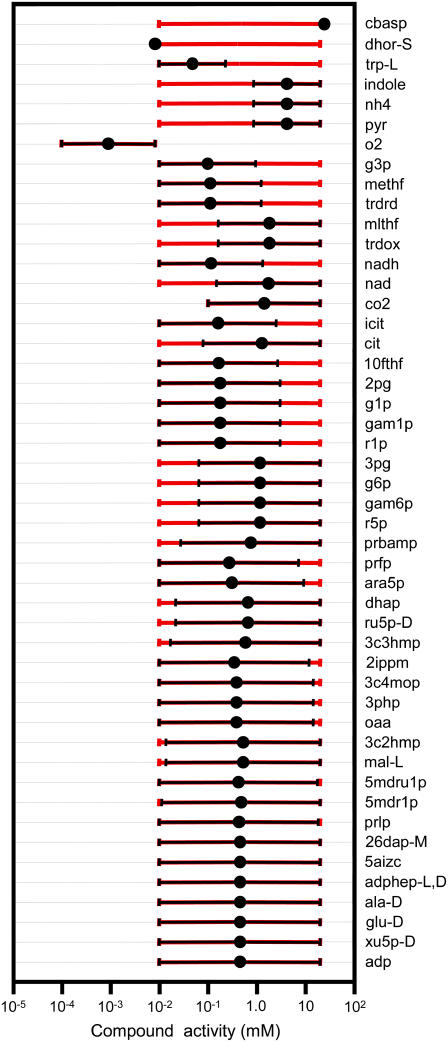
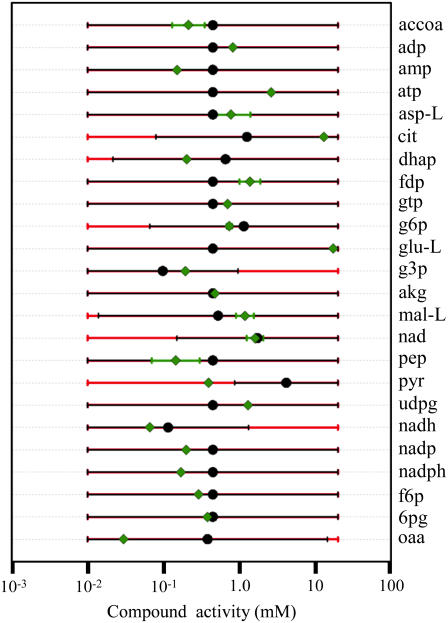
A new form of metabolic flux analysis (MFA) called thermodynamics-based metabolic flux analysis (TMFA) is introduced with the capability of generating thermodynamically feasible flux and metabolite activity profiles on a genome scale. TMFA involves the use of a set of linear thermodynamic constraints in addition to the mass balance constraints typically used in MFA. TMFA produces flux distributions that do not contain any thermodynamically infeasible reactions or pathways, and it provides information about the free energy change of reactions and the range of metabolite activities in addition to reaction fluxes. TMFA is applied to study the thermodynamically feasible ranges for the fluxes and the Gibbs free energy change, Delta(r)G', of the reactions and the activities of the metabolites in the genome-scale metabolic model of Escherichia coli developed by Palsson and co-workers. In the TMFA of the genome scale model, the metabolite activities and reaction Delta(r)G' are able to achieve a wide range of values at optimal growth. The reaction dihydroorotase is identified as a possible thermodynamic bottleneck in E. coli metabolism with a Delta(r)G' constrained close to zero while numerous reactions are identified throughout metabolism for which Delta(r)G' is always highly negative regardless of metabolite concentrations. As it has been proposed previously, these reactions with exclusively negative Delta(r)G' might be candidates for cell regulation, and we find that a significant number of these reactions appear to be the first steps in the linear portion of numerous biosynthesis pathways. The thermodynamically feasible ranges for the concentration ratios ATP/ADP, NAD(P)/NAD(P)H, and H(extracellular)(+)/H(intracellular)(+) are also determined and found to encompass the values observed experimentally in every case. Further, we find that the NAD/NADH and NADP/NADPH ratios maintained in the cell are close to the minimum feasible ratio and maximum feasible ratio, respectively.


Figures

FIGURE 1
FIGURE 1
Comparison of estimated ΔrG′° to experimentally measured ΔrG′°. Estimated ΔrG′° values (solid diamonds) are shown and compared to experimentally measured ΔrG′° values (shaded squares) for every reaction in the iJR904 model for which data exists in the NIST database (39) within the temperature and pH limitations (288–308 K and pH of 6–8). In some cases, multiple data points existed in the NIST database at the suitable conditions. In these cases, the average ΔrG′° is shown along with the standard deviation in the data (shaded error bars). The uncertainty in the estimated ΔrG′° (solid error bars) calculated from the group contribution method (22) is also shown verifying that all but three of the measured ΔrG′° fall within the range of uncertainty of the estimated ΔrG′°.
FIGURE 2
FIGURE 2
Comparison of estimated ΔfG′° to ΔfG′° available in the literature. Estimated ΔfG′° values (solid diamonds) are shown and compared to literature values of ΔfG′° (shaded squares) for every compound in the iJR904 model for which literature data was found (–42). The uncertainty in the estimated ΔfG′° (solid error bars) calculated from the group contribution method (22) are also shown verifying that all but one of the literature ΔfG′° values fall within the range of uncertainty of the estimated ΔfG′°.
FIGURE 3
FIGURE 3
Effect of ionic strength on ΔrG′°. A histogram of the differences between ΔrG′° at an ionic strength of zero (ΔrG′° (I = 0)) and ΔrG′° at an ionic strength of 0.2 M (ΔrG′° (I = 0.2 M)) for all of the reactions in the iJR904 model. The bin sizes in the histogram are all 0.25 kcal/mol. Greater than 95% of the differences are within 1 kcal/mol of zero.
FIGURE 4
FIGURE 4
Ranges for ΔrG′ of required and substitutable reactions. The thermodynamically feasible ranges for ΔrG′ of the 45 essential and substitutable reactions with the narrowest feasible ΔrG′ range. The ranges are the widest when the uncertainty in ΔrG′° is accounted for by allowing the group contribution energy values to vary within their standard errors (red error bars). If the uncertainty is assumed to be zero, the feasible ranges for ΔrG′ decrease significantly (black error bars), and ΔrG′ of the reaction dihydroorotase becomes constrained to near zero. When the two error bars do not overlap completely, the larger error bar always corresponds to the range calculated, accounting for uncertainty.
FIGURE 5
FIGURE 5
Thermodynamically feasible activity ranges. The thermodynamically feasible metabolite activity ranges are shown for all of the compounds with a feasible range that is less than the bounds placed on the metabolite activities (0.01–20 mM with the exception of the compounds listed in Table 1, n-carbamoyl-L-aspartate and dihydroorotate). When the uncertainty in the estimated ΔrG′° values is assumed to be zero, the metabolite activities are the most tightly constrained (black error bars). Tightly constrained metabolites include the main reactant and product of the bottleneck reaction dihydroorotase, n-carbamoyl-L-aspartate (cbasp) and dihydroorotate (dhor), respectively. When the uncertainty in the estimated ΔrG′° values is accounted for, the feasible activity ranges increase significantly (red error bars). When the two error bars do not overlap completely, the larger error bar always corresponds to the range calculated, accounting for uncertainty.
FIGURE 6
FIGURE 6
Comparison to metabolic concentrations reported in the literature. Experimentally measured concentration ranges (green diamonds and green error bars) reported in the literature (49,54,55) are shown along with the thermodynamically feasible activity ranges for the same metabolites found using TMFA with no uncertainty (black circles and error bars). The black circles show the logarithmic mean for the feasible activity range (formula image). The feasible activity ranges for the metabolites found using TMFA accounting for uncertainty in estimated ΔrG′° values are also shown (red error bars). When the two error bars do not overlap completely, the larger error bar always corresponds to the range calculated, accounting for uncertainty.

References

    1. Alberty, R. A. 1998. Calculation of standard transformed formation properties of biochemical reactants and standard apparent reduction potentials of half reactions. Arch. Biochem. Biophys. 358:25–39. - PubMed
    1. Kummel, A., S. Panke, and M. Heinemann. 2006. Putative regulatory sites unraveled by network-embedded thermodynamic analysis of metabolome data. Mol. Syst. Biol. 2:2006–2034. - PMC - PubMed
    1. Roels, J. A. 1983. Energetics and Kinetics in Biotechnology. Elsevier Biomedical Press, Amsterdam and New York.
    1. Westerhoff, H. V., and International Study Group of Biological Thermodynamics Control and Kinetics. 1994. Biothermokinetics. Intercept, Andover, Hampshire, England.
    1. Nielsen, J. 1997. Metabolic control analysis of biochemical pathways based on a thermokinetic description of reaction rates. Biochem. J. 321:133–138. - PMC - PubMed

Publication types