. 2006 Dec;18(12):3670-85.
doi: 10.1105/tpc.106.046953. Epub 2006 Dec 15.

The coactivator function of Arabidopsis NPR1 requires the core of its BTB/POZ domain and the oxidation of C-terminal cysteines

Affiliations

The coactivator function of Arabidopsis NPR1 requires the core of its BTB/POZ domain and the oxidation of C-terminal cysteines

Amanda Rochon et al. Plant Cell. 2006 Dec.

Abstract

NONEXPRESSOR OF PATHOGENESIS-RELATED GENES1 (NPR1) regulates systemic acquired resistance (SAR) in Arabidopsis thaliana, and current models propose that after treatment with salicylic acid (SA), Cys-82 and Cys-216 of NPR1 are reduced, leading to nuclear import. The interaction of nucleus-localized NPR1 with TGA transcription factors results in the activation of defense genes, including the SAR marker PATHOGENESIS-RELATED-1 (PR-1), and the deployment of SAR. Little is known about how TGA factors or NPR1 regulate transcription or whether a TGA-NPR1 complex forms on DNA. We show that TGA2 and NPR1 are recruited to PR-1 independently of each other and of SA treatment. Consistent with the result that a triple knockout in TGA2/5/6 derepresses PR-1, in vivo plant transcription assays revealed that TGA2 is not an autonomous transcription activator but is a transcriptional repressor in both untreated and SA-treated cells. However, after stimulation with SA, TGA2 is incorporated into a transactivating complex with NPR1, forming an enhanceosome that requires the core of the NPR1 BTB/POZ domain (residues 80 to 91) and the oxidation of NPR1 Cys-521 and Cys-529. These Cys residues are found in a new type of transactivation domain that we term Cys-oxidized. These data further our understanding of the mechanism by which TGA2 and NPR1 activate Arabidopsis PR-1.


Figures

Figure 1.
Figure 1.
NPR1 Is a Coactivator Required for Transcriptional Activation by a TGA2-NPR1 Complex in SA-Treated Cells Only. (A) Graphic representation of the PR-1 gene. The straight arrows and the numbers indicate the positions of the PCR primers used for ChIP experiments. LS5 and LS7 are two DNA regions containing the TGA factor cognate binding sequence TGACG (Lebel et al., 1998). (B) ChIPs of TGA2:His expressed in tga2/5/6 knockout plants. At right is an RNA gel blot illustrating that the TGA2:His protein complemented the tga2/5/6 mutation and restored PR-1 inducibility. (C) ChIPs of TGA2:His expressed in npr1-3 mutant (npr1-3) Arabidopsis plants. At right is an RNA gel blot illustrating that the TGA2:His protein expressed in the npr1-3 mutation did not bring about expression of PR-1 regardless of whether tissues were treated or not with SA. An RNA gel blot from wild-type plants treated with SA is shown for comparison. For (B) and (C), ChIPs were conducted with anti-His antibodies conjugated to agarose beads. (D) ChIPs of NPR1 from wild-type (NPR1) and npr1-3 mutant (npr1-3) plants. At right is an RNA gel blot illustrating that the PR-1 gene is not expressed in the npr1-3 mutant and that expression in the wild-type plant is dependent upon SA treatment. (E) ChIPs of NPR1 from tga2/5/6 knockout Arabidopsis plants. At right is an RNA gel blot illustrating that the PR-1 gene is not expressed in the tga2/5/6 mutant regardless of whether tissues have been treated or not with SA. An RNA gel blot from wild-type plants treated with SA is shown for comparison. For (D) and (E), ChIPs were conducted with anti-NPR1 antibodies for which the specificity has been demonstrated previously (Després et al., 2000). In (B) to (E), tissues were untreated (No SA) or treated for 6 h with 1 mM SA. PI indicates that ChIP was performed with preimmune serum. PCR was conducted with PR-1 promoter–specific primers. The arrow in each panel indicates the location of the PCR product. The NPR1-3 protein is a deletion version of NPR1 (Cao et al., 1997) that has lost the antigenic region used to raise the anti-NPR1 antibodies used in this study. The inputs represent 2% of the immunoprecipitated material (50-fold dilution). 3X and 5X indicate that the PCR was performed with three and five times the amount of immunoprecipitated material, respectively, to demonstrate that the PCR was in the linear range. In lanes 13 and 14 in (D), one-tenth of the amount of immunoprecipitated material used in lanes 6 and 12, respectively, was used to perform the PCR to demonstrate that the PCR was in the linear range. RNA stained with ethidium bromide is shown for loading comparison. (F) Histograms illustrating the fact that TGA2 tethered to DNA through Gal4 DB fused to the N terminus (TGA2:DB) or C terminus (TGA2:DB-Ct) does not activate transcription, whereas a chimeric transcription activator composed of the Gal4 DB fused to the transactivation domain of viral protein 16 (Gal4 DB:VP16 TA) does. Gal4 DB represents the baseline level of transcription. (G) Histograms illustrating the transcription activation of NPR1 tethered to DNA through Gal4 DB (NPR1:DB). NPR1 indicates the absence of fusion. – indicates that only the reporter and internal standard vectors were bombarded into the tissues; no effector was introduced. (H) Histograms illustrating the effect of NPR1 on the transcriptional activity of TGA2:DB. NPR1 indicates that the protein is expressed without a fusion. (I) Histograms illustrating the fact that TGA2 tethered to DNA through Gal4 DB (TGA2:DB) interacts very poorly with NPR1:TA in the absence of SA treatment. In (F) to (I), Arabidopsis leaves were left untreated (white bars) or were treated for 24 h with 1 mM SA (gray bars). The constructs were transfected along with the 5X UASGAL4:firefly luciferase reporter and the CaMV 35S:renilla luciferase internal standard vectors. Data are reported as relative luciferase units. The fold activation represents the relative luciferase units obtained with the given protein or protein pair divided by the relative luciferase units obtained with the unfused Gal4 DB construct alone (baseline transcription). Values are from 25 samples and represent averages ± sd. Every bar represents five bombardments repeated five times (n = 25). (J) Histograms illustrating the effect of NPR1 and nim1-2 on the transcriptional activity of the TGA2-NPR1 complex. All proteins were native (without fusion), with the exception of NPR1:TA (NPR1 fused to the VP16 transactivation domain), which was used to assess the level of interaction between NPR1 and TGA2 in the context of the PR-1 promoter. The reporter system was the Arabidopsis PR-1 promoter fused to firefly luciferase. The CaMV 35S promoter:renilla luciferase fusion was used as an internal standard. − indicates that no effector was bombarded along with the reporter and internal standard vectors. Cruciferin is an Arabidopsis storage protein used here to illustrate the background level of this system when expressing an unrelated protein. Gal4 DB served the same purpose. Arabidopsis leaves were left untreated (white bars) or were treated for 24 h with 1 mM SA (gray bars). Data are reported as relative luciferase units. Values are from 25 samples and represent averages ± sd. Every bar represents five bombardments repeated five times (n = 25).
Figure 2.
Figure 2.
The BTB/POZ Domain of NPR1 Is Required for PR-1 Induction. (A) Multiple alignment of selected BTB/POZ domains. Residues blocked in black are conserved among all sequences. Numbers refer to the amino acid position in NPR1. Straight arrows and coils indicate the positions of β-strands and helices in the PLZF crystal structure, respectively. α and η indicate α- and 310-helices, respectively, and β refers to β-strands. The bent arrows indicate the positions where the NPR1 deletion proteins begin. The horizontal brackets below the amino acid sequences of α2 and α3 indicate the residues that have been mutated to Ala in the Ala substitution mutant. Cys-150 bears a C-to-Y mutation in the npr1-2 mutant, which abolishes interaction with TGA2, PR gene activation, and deployment of SAR (Cao et al., 1997; Zhang et al., 1999; Després et al., 2000). The inset represents directed yeast two-hybrid assays using the filter test and the outcome of the experiments. nim1-2 is a mutant version of NPR1 that bears a His-to-Tyr replacement in one of the ankyrin repeats (Ryals et al., 1997), which abolishes interaction with TGA factors (Després et al., 2000, 2003). Y (yes) indicates an interaction, whereas N (no) indicates an absence of interaction (white color after 24 h of incubation with X-Gal). (B) RNA gel blot analysis using NPR1 or PR-1 probes. RNA stained with ethidium bromide is shown for loading comparison. Lane 1 contains RNA from wild-type Arabidopsis, and lane 2 contains RNA from the npr1-3 mutant. The remaining lanes contain RNA from npr1-3 lines expressing the following constructs: wild-type NPR1 (lanes 3 and 4), the Ala substitution mutant (lanes 5 and 6), and the deletion mutants Δ110 (lanes 7 and 8), Δ66 (lanes 9 and 10), Δ44 (lanes 11 and 12), and Δ22 (lanes 13 and 14). Results from two independent transgenic lines are shown per construct. Specific line numbers follow the construct name. (C) and (D) Top panels, immunoblot analysis of proteins from wild-type Arabidopsis, the npr1-3 mutant (NPR1-3), and the npr1-3 background lines expressing NPR1, the Ala substitution mutant, and Δ110 as described in (B). An anti-NPR1 antibody (Després et al., 2000) was used. Bottom panels, Ponceau staining of the membranes shown in the top panels. In (D), the open arrow indicates the position of the full-length NPR1 protein (66 kD), whereas the closed arrow indicates the position of the truncated protein Δ110 (54.4 kD). The asterisk indicates a protein interacting nonspecifically with the antibody.
Figure 3.
Figure 3.
The Core of the NPR1 BTB/POZ Is Required for the TGA2-Dependent Coactivator Function of NPR1 in SA-Treated Cells. (A) Histograms illustrating the effect of NPR1 and the mutants described for Figure 2 on the transcriptional activity of the TGA2-NPR1 complex tethered to DNA through Gal4 DB fused to TGA2. Results obtained with TGA2:DB alone (−) are also shown. (B) Histograms illustrating the interaction of NPR1 and the mutants described in (A) fused to the VP16 transactivation domain with TGA2 fused to the Gal4 DB. Results obtained with Gal4 DB alone (Gal4 DB), Gal4 DB coexpressed with NPR1:TA (Gal4 DB + NPR1:TA), and TGA2:DB alone (−) are also shown. For (A) and (B), conditions were identical to those described for Figure 1. Data are reported as relative luciferase units. Values are from 25 samples and represent averages ± sd. Every bar represents five bombardments repeated five times (n = 25).
Figure 4.
Figure 4.
NPR1 Harbors an Autonomous Transactivation Domain in the Last 80 Residues. (A) Histograms illustrating the transcriptional activity of the NPR1 BTB/POZ domain, the deletion mutants of the BTB/POZ, and the Ala substitution mutant tethered to DNA through Gal4 DB. The deletion and the Ala substitution mutants were created starting with the NPR1 BTB/POZ domain. The BTB/POZ region represents the first 190 amino acids of NPR1. (B) Scheme of NPR1 and the deletions analyzed in (C). Numbers preceded by Δ indicate the starting amino acid for that particular deletion mutant. NLS indicates the nuclear localization signal. Ankyrin represents the region containing the ankyrin repeats as defined by Pfam and SMART. Diagram is drawn to scale. (C) Histograms illustrating the transcriptional activity of the NPR1 deletion mutants described for (B) tethered to DNA through Gal4 DB. For (A) and (C), conditions were identical to those described for Figure 1. Data are reported as relative luciferase units. Values are from 25 samples and represent averages ± sd. Every bar represents five bombardments repeated five times (n = 25).
Figure 5.
Figure 5.
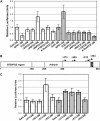
Oxidation of Cys-521 and Cys-529 Correlates with Transcriptional Activation of the PR-1 Gene by the TGA2-NPR1 Complex. (A) Sequence of amino acids located between positions 513 and 540. (B) Histograms illustrating the transcriptional activity of the Δ513 deletion mutant of NPR1 and the effect of mutating Cys-521 or Cys-529 within the context of the Δ513 protein. Proteins were tethered to DNA through Gal4 DB. (C) Blot analysis of NPR1Δ513 immunoprecipitate used to assess the in vivo redox status of residues Cys-521 and Cys-529 present in cells of Arabidopsis leaves treated for 24 h with SA (SA) or left untreated (No SA). Red indicates immunoprecipitates from proteins labeled for reduced Cys residues, and Ox indicates immunoprecipitates from proteins labeled for oxidized Cys (see Methods). (D) Histograms illustrating the transcriptional activity of the full-length NPR1 and the effect of mutating Cys-521 or simultaneously Cys-521 and Cys-529 within the context of the full-length NPR1. Proteins were tethered to DNA through Gal4 DB. (E) Histograms illustrating the interaction of NPR1 with the Cys-521 or the Cys-521 and Cys-529 mutants described for (D) with TGA2 fused to the VP16 transactivation domain. nim1-2, which does not interact with TGA2, was also expressed with TGA2:DB as a negative control. NPR1, nim1-2, and the mutants described for (D) were all fused to the Gal4 DB. NPR1:DB was also expressed along with the VP16 transactivation domain (NPR1:DB + TA) as another negative control. (F) Histograms illustrating the effect of NPR1, Cys-521, or the Cys-521 and Cys-529 mutants described for (D) on the transcriptional activity of TGA2:DB. All proteins, except TGA2:DB, were expressed without a fusion. (G) Histograms illustrating the interaction of NPR1, Cys-521, or the Cys-521 and Cys-529 mutants described for (D) all fused to the VP16 transactivation domain with TGA2 fused to the Gal4 DB. For (B), (D), (E), (F), and (G), conditions were identical to those described for Figure 1. Data are reported as relative luciferase units. Values are from 25 samples and represent averages ± sd. Every bar represents five bombardments repeated five times (n = 25). (H) Histograms illustrating the effect of NPR1, nim1-2, and the Cys-521 or the Cys-521 and Cys-529 mutants on the transcriptional activity of the TGA2-NPR1 complex. All proteins were native (without fusion). The reporter system was the Arabidopsis PR-1 promoter fused to luciferase. The CaMV 35S promoter:renilla luciferase fusion was used as an internal standard. − indicates that no effector was bombarded along with the reporter and internal standard vectors. Arabidopsis leaves were left untreated (white bars) or were treated for 24 h with 1 mM SA (gray bars). Data are reported as relative luciferase units. Values are from 25 samples and represent averages ± sd. Every bar represents five bombardments repeated five times (n = 25). (I) RNA gel blot analysis using NPR1 or PR-1 probes. RNA stained with ethidium bromide is shown for loading comparison. Lane 1 contains RNA from wild-type Arabidopsis, and lane 2 contains RNA from the npr1-3 mutant. Lanes 3 and 4 contain RNA from two independent npr1-3 transgenic lines expressing NPR1 bearing Cys-to-Ser mutations at positions 521 and 529. Specific line numbers follow the construct name. PR1 20 h and PR1 100 h represent 20 h and 100 h of autoradiography, respectively. All lanes are from the same gel and blot. (J) Top panel, immunoblot analysis of proteins from wild-type Arabidopsis, the npr1-3 mutant (NPR1-3), and the npr1-3 background lines expressing the mutant described for (I). An anti-NPR1 antibody (Després et al., 2000) was used. Bottom panel, Ponceau staining of the membranes shown in the top panel.
Figure 6.
Figure 6.
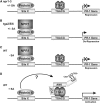
Working Model for the Regulation of PR-1 by the TGA2-NPR1 Enhanceosome. (A) In an npr1 mutant plant such as npr1-3, there is no NPR1-dependent derepression of PR-1 and there is no incorporation of TGA2 into a TGA2-NPR1 enhanceosome. PR-1 is repressed. Because NPR1 is recruited to PR-1 independently from TGA2 and NPR1 does not contain a known DNA binding domain, we postulate that in a wild-type plant NPR1 is recruited through an unknown protein (Protein X) binding to an unknown DNA element (Site X). Although TGA3 has been shown to be recruited to PR-1, its interaction with the promoter is both NPR1- and SA-dependent (Johnson et al., 2003). Therefore, it is unlikely that NPR1 would be recruited by TGA3 or that TGA3 is the postulated Protein X. Another possible scenario to explain the recruitment of NPR1 to PR-1 is that NPR1 interacts directly with DNA using an unidentified DNA binding domain. Further experimentation is required to distinguish between these two possibilities. (B) In the tga2/5/6 triple knockout (Zhang et al., 2003), NPR1 is recruited to the PR-1 promoter, which becomes derepressed. In these plants, the TGA2-NPR1 enhanceosome is not recruited to the PR-1 promoter because of the absence of TGA2, TGA5, and TGA6. (C) In a wild-type plant unstimulated with SA, both NPR1 and TGA2 are recruited to the PR-1 promoter independent of each other. However, under resting conditions, NPR1 and TGA2 do not interact with each other. Again here, NPR1 is postulated to be recruited through an unknown protein (Protein X). (D) In the presence of SA, NPR1 forms an enhanceosome with TGA2. Transactivation of the complex requires the oxidation of Cys-521 and Cys-529, which are found within the confines of a transactivation domain (TAD) in the C terminus of NPR1. The BTB/POZ domain of NPR1 is hypothesized to interact with TGA2. NPR1 is postulated to be transferred from the unknown Protein X to TGA2. However, it is possible that NPR1, Protein X, and TGA2 all interact at the same time. The question mark illustrates this fact. The exact nature of the enhanceosome remains undetermined, but it contains at the very least NPR1 and TGA2.

Similar articles

Cited by

References

    1. Abate, C., Patel, L., Rauscher, F.J., III, and Curran, T. (1990). Redox regulation of fos and jun DNA-binding activity in vitro. Science 249 1157–1161. - PubMed
    1. Ahmad, K.F., Engel, C.K., and Prive, G.G. (1998). Crystal structure of the BTB domain from PLZF. Proc. Natl. Acad. Sci. USA 95 12123–12128. - PMC - PubMed
    1. Aravind, L., and Koonin, E.V. (1999). Fold prediction and evolutionary analysis of the POZ domain: Structural and evolutionary relationship with the potassium channel tetramerization domain. J. Mol. Biol. 285 1353–1361. - PubMed
    1. Bardwell, V.J., and Treisman, R. (1994). The POZ domain: A conserved protein-protein interaction motif. Genes Dev. 8 1664–1677. - PubMed
    1. Benezra, R. (1994). An intermolecular disulfide bond stabilizes E2A homodimers and is required for DNA binding at physiological temperatures. Cell 79 1057–1067. - PubMed

Publication types

MeSH terms

Associated data