. 2006 Dec;19(12):1619-29.
doi: 10.1021/tx060122q.

Arsenic disruption of steroid receptor gene activation: Complex dose-response effects are shared by several steroid receptors

Affiliations

Arsenic disruption of steroid receptor gene activation: Complex dose-response effects are shared by several steroid receptors

Jack E Bodwell et al. Chem Res Toxicol. 2006 Dec.

Abstract

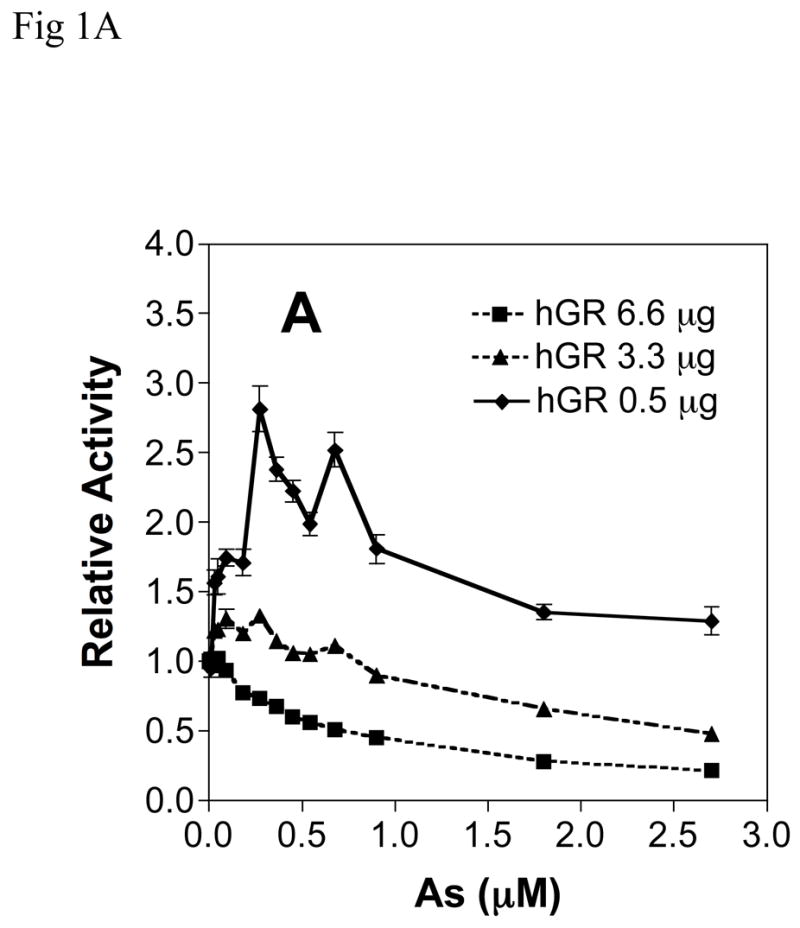
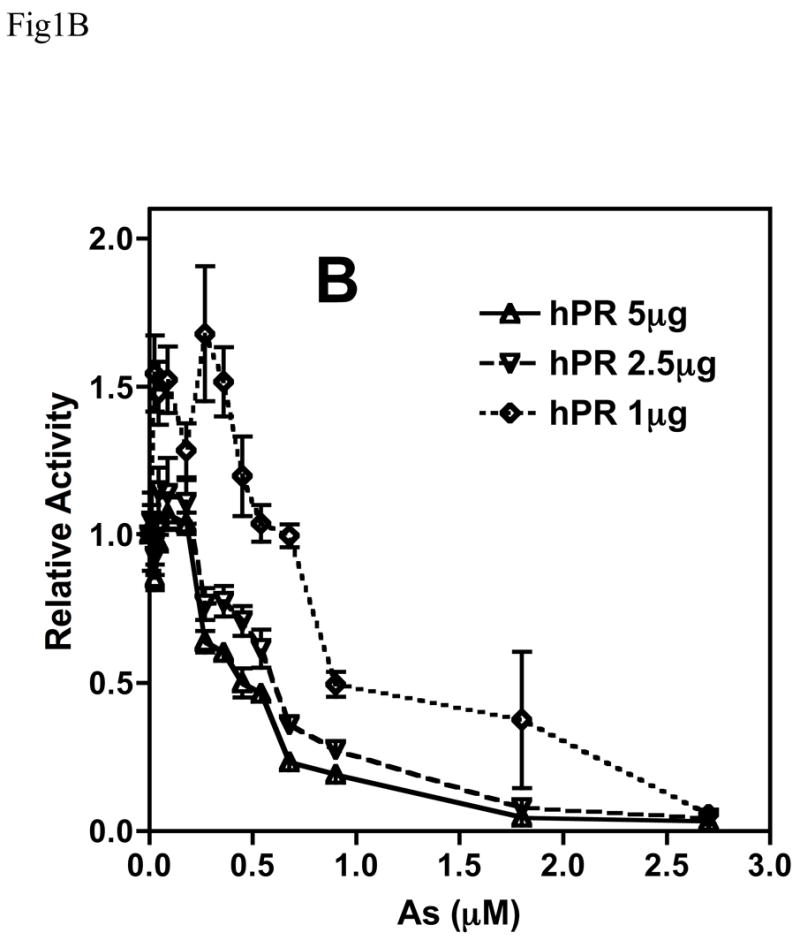
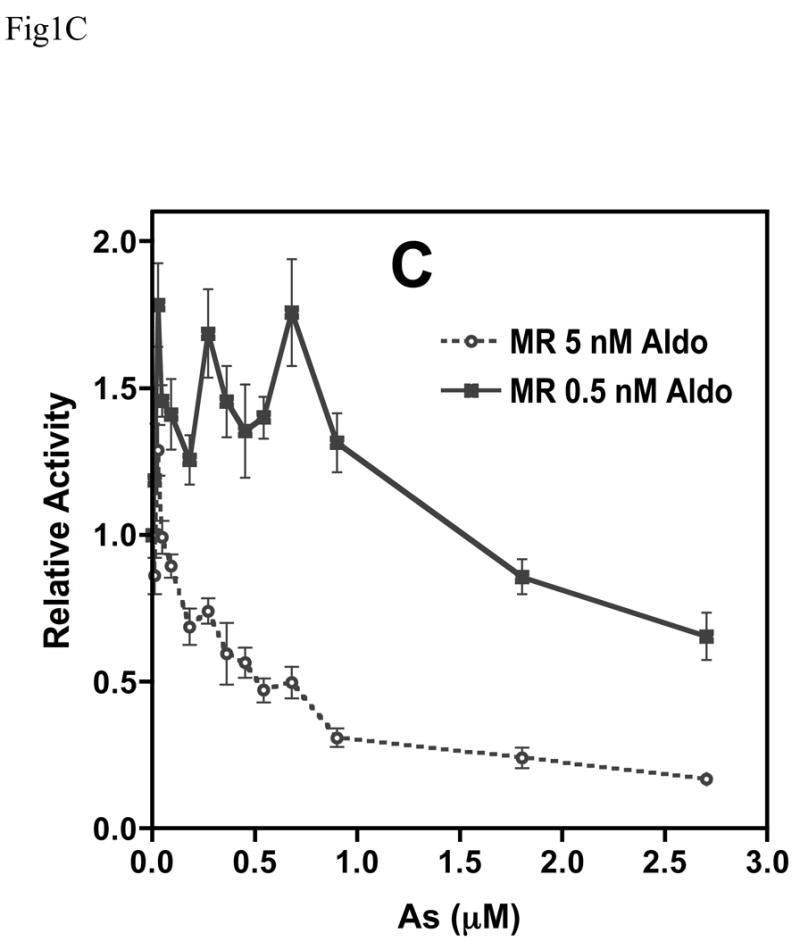
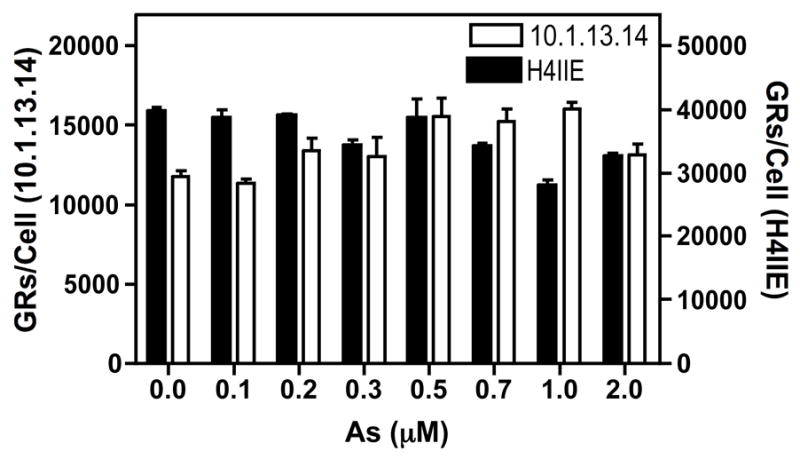
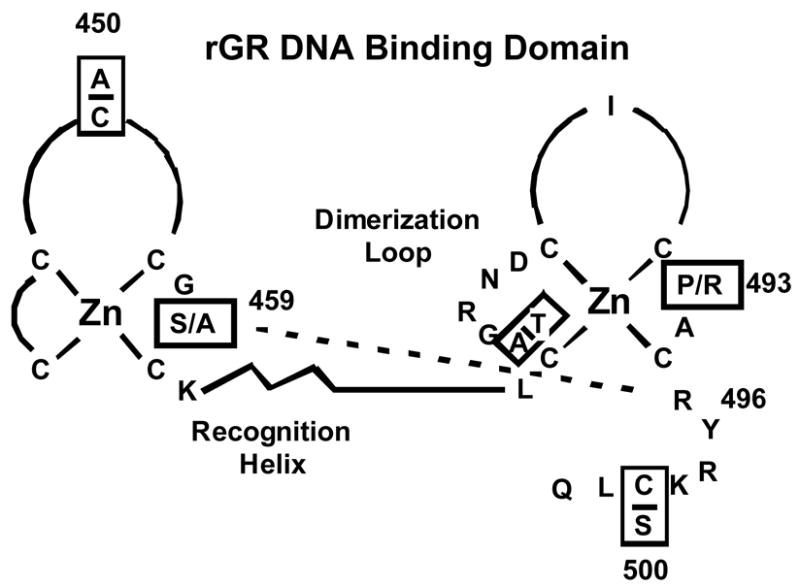
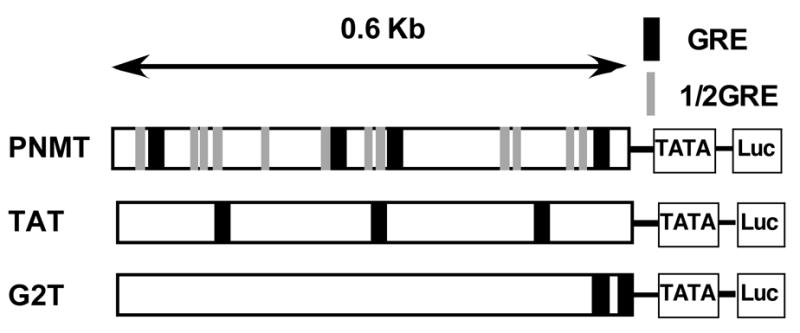
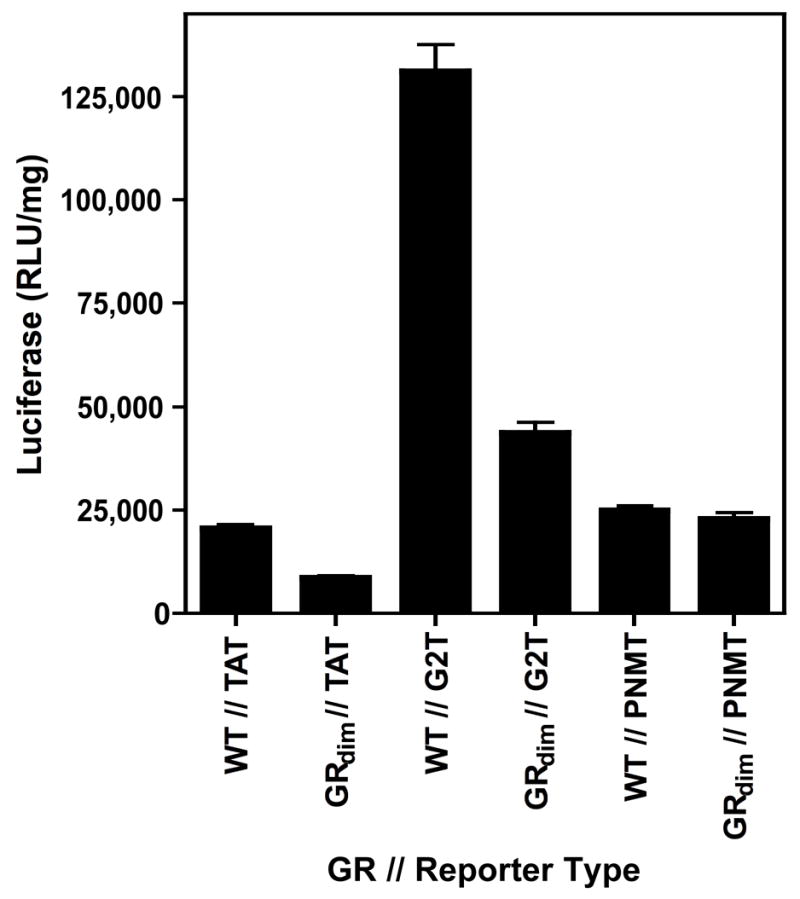
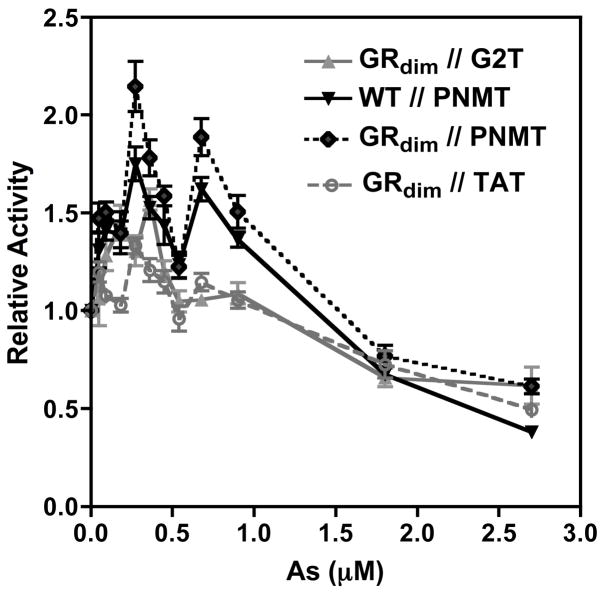
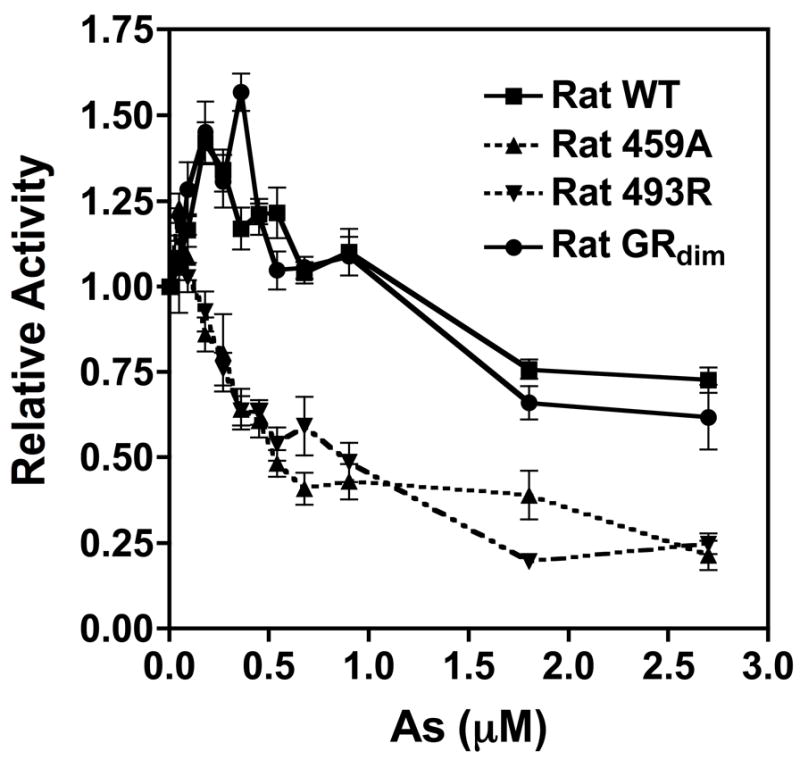
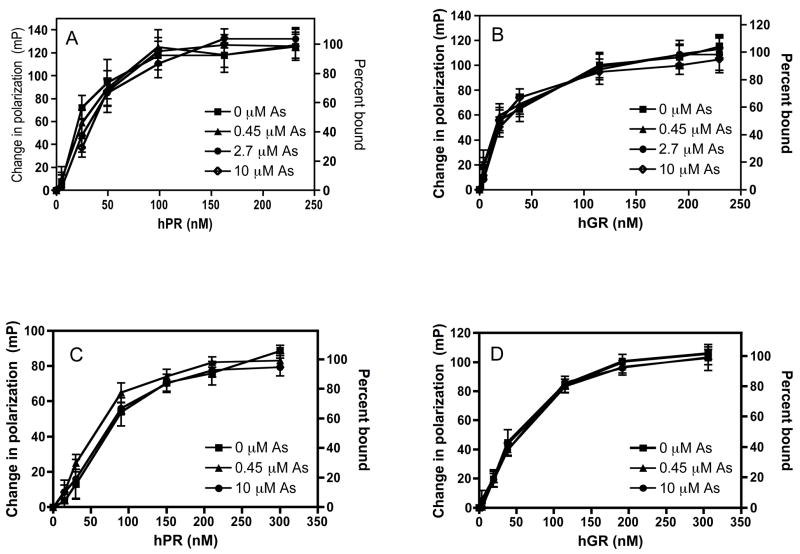
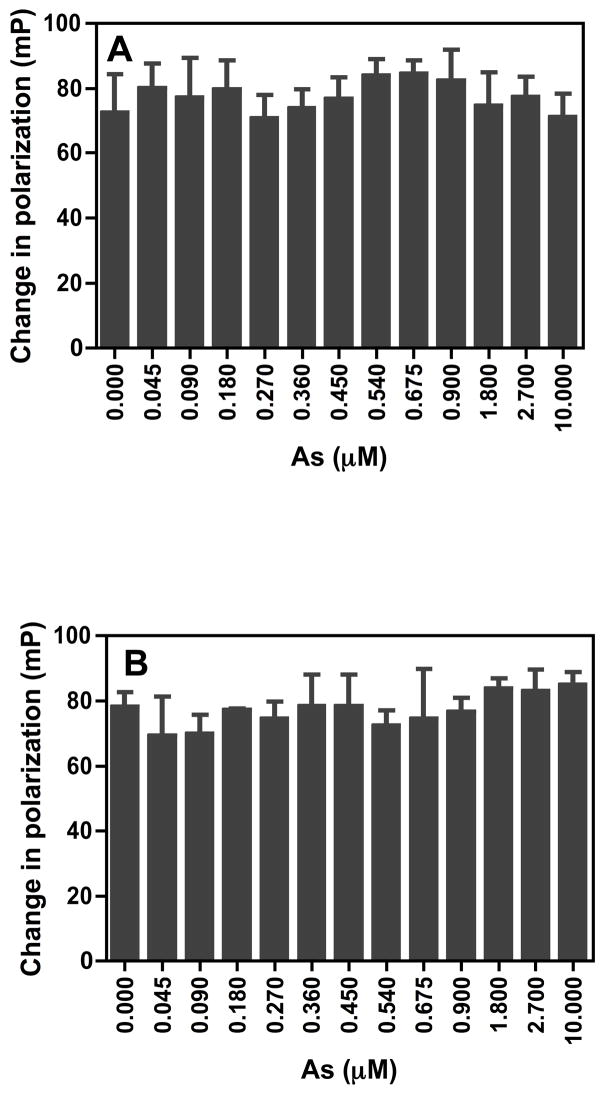
Chronic intake of arsenic (As) has been associated with increased risk of cancer, diabetes, developmental and reproductive problems, and cardiovascular disease. Recent studies suggest increased health risks with drinking water levels as low as 5-10 ppb. We previously reported that As disrupts glucocorticoid receptor (GR) mediated transcription in a very complex fashion. Low As levels (0.1-0.7 microM) stimulated transcription, whereas slightly higher levels (1-3 microM) were inhibitory. The DNA binding domain (DBD) was the minimal region of GR required for the response to As. Mutations in the DBD that alter the conformation of the dimerization domain (D-loop) to a DNA-bound GR conformation abolished the stimulatory effect and enhanced the inhibitory response to As. Here we report that receptors for progesterone (PR) and mineralocorticoids display a complex As response similar to that of the GR, suggesting a common mechanism for this effect. The complex response to As is not due to altered steroid or receptor levels. Moreover, a well-characterized GR dimerization mutant displayed a wild-type biphasic response to As for several divergent reporter genes, suggesting that dimerization is not critical for the response to As. Fluorescence polarization studies with purified PR and GR demonstrated that the specific PR/GR-DNA interaction is not altered in the presence of As. These results indicate that the numerous and diverse human health effects associated with As exposure may be mediated, at least in part, through its ability to simultaneously disrupt multiple hormone receptor systems.


Figures

Figure 1
Figure 1. Other SRs have a biphasic response to As
Different amounts of DNA encoding hGR (pCMV5 hGR, Panel A, reproduced from (11)), hPR(pCR3.1 PRB, Panel B) or a single level of rMR (PCMV4/neo/MR, Panel C) were transfected into EDR3 cells with the G2T reporter gene as described in Experimental Procedures. Cells were treated with 50nM Dex (hGR), 50nM progesterone (hPR), or the indicated levels of aldosterone (rMR) with and without As (see Experimental Procedures for actual concentrations) for ~ 18hrs. Cells were processed and cytosols assayed for luciferase and protein as described in the Experimental Procedures. Figures 1–7 are representative of at least 3 independent experiments and each point is the mean of 6 replicates per point. Variation is presented as ±SEM. For individual treatments, each point was divided by the value of the Dex without As treatment. This normalization to relative activity allows comparison of As effects on treatments that have different transcriptional activity. Dex without As values (kRLU/mg) for panel A (most to least transfected DNA) are 426.6, 249.3, and 57.8 with a 74± 8 average fold increase over no hormone values and for panel B 169.8, 138.7, and 72.5 (30±12 fold increase). Values for panel C were 223.7 and 67.8 (8-5fold increase) for 5E–9 and 5E–10 M aldosterone respectively.
Figure 2
Figure 2. As does not affect SR hormone binding capacity
A whole cell hormone binding assay (see Experimental Procedures) was used to determine GR specific binding of [3H]-Dex (20nM) in 10.1.13.14 (EDR-3 cells stably expressing 10,00–5,000 mGRs/cell) and H4IIE cells (30,000–40,000 endogenous rGRs/cell).
Figure 3
Figure 3. Location of mutants in the GR DBD known to alter the response to As
Schematic representation of the rGR DBD indicating the two zinc finger structures, the DNA recognition helix and the dimerization loop. Amino acid positions referred to in the text are numbered according to the rat structure. Point mutations producing the DNA bound conformation are in horizontal boxes. The H-bond between S459 to P493 is indicated by dashed line. Vertical boxes show mutations of the two free cysteines in the DBD and the tilted box shows the position of the GRdim mutation.
Figure 4
Figure 4. GRE configuration of luciferase reporter genes
Diagrammatic representation of thepromoter regions of the TAT-Luc (−3079 to −2034) and PNMT-Luc (−977 to −513) genes used to evaluate GRdim. The pattern of GREs and 1/2GREs in each gene is compared to the G2T reporter gene.
Figure 5
Figure 5. Characterization of the effect of GRdim on reporter gene expression
EDR-3 cells were transfected with the G2T, TAT-Luc or PNMT-Luc reporter genes and a range of concentrations of wildtype or GRdim encoding DNA. Cells were processed and resultant cytosols assayed as described in Fig 1. A whole binding assay was performed in order to be sure that treatments had comparable levels of GRs. Wild-type and GRdim levels were equivalent for experiments using the TAT (3,000–4,000 rGR/cell) and the PNMT (4,000–5,000 rGRs/cell) reporters, while with the G2T reporter there was more GRdim (4800±2000 GRs/cell) than wildtype (2700±200 rGRs/cell). Basal activity for wild type and GRdim were 3.7 and 3.3 kRLU/mg respectively for TAT-Luc, 3.3 and 3.2 for G2T and 4.1 and 4.1 for PNMT- Luc.
Figure 6
Figure 6. GRdim has a wildtype response to As
EDR-3 cells were transfected with GRdim or wildtype rGR along with the TAT-Luc, PNMT-Luc or G2T reporter genes, treated with As, and processed as described in Fig 1. Dex without As values (and fold increase over basal) for Wt and GRdim were 20.6 (6.4) and 8.5 (3.5) kRLU/mg respectively for TAT-Luc, 125.0 (38.0) and 47.0 (15.4) for G2T, and 24.2 (6.7) and 22.8 (6.4) for PNMT-Luc.
Figure 7
Figure 7. Comparison of GRdim and the DNA conformational mutants response to As
The response of rGR, and GRdim to As for the G2T reporter (Fig 6) is overlaid with the response for the two DNA conformational mutants (459A and 493R,(11)) to the same reporter. (Data for wt, 459A, and 493R reproduced from (11)) Dex without As values for GRdim are listed in Fig 6 legend while those for WT, 459A and 493R had 69.8, 3.8, and 10.4 kRLU/mg respectively (11)
Figure 8
Figure 8. As does not affect equilibrium binding curves of hPR and hGR to FITC-G2T and FITC-GT
Increasing amounts of hPR (Panels A and C) or hGR (Panels B and D) were incubated with 1 nM FITC-G2T (Panels A and B) or FITC-GT (Panels C and D) in FP buffer (plus 1 mM GSH and 7.5 mM CHAPS for hGR only) or with the indicated As concentrations. FP was measured as described in Experimental Procedures at equilibrium. “Change in polarization (mP)” represents the difference between polarization values measured at each concentration of receptor and the polarization measured with no added receptor. “Percent bound” was calculated as described in Experimental Procedures. Each binding curve is representative of two or three independent experiments. Three replicates were measured for each data point within each independent experiment, and the error bars shown are error-propagated standard deviations (see Experimental Procedures).
Figure 9
Figure 9. A wide range of As concentrations does not affect hPR (Panel A) or hGR (Panel B) binding to FITC-G2T
A fixed receptor level (approximately 70% of maximal binding) was incubated with 1 nM FITC-G2T in FP buffer (plus 1 mM GSH and 7.5 mM CHAPS for hGR only) with varying levels of As (final concentrations are indicated on the x-axis). FP was measured as described in the Fig 8 legend. The data in each panel represent the average of two independent experiments, ± average error.

References

    1. ATSDR. Toxicological Profile for Arsenic (Update) Agency for Toxic Substances and Disease Registry, SUDHHS, PHS; Washington D.C: 1999. - PubMed
    1. NRC. Arsenic in Drinking Water. National Research Council; Washington D.C.: 1999.
    1. Karagas MR, Stukel TA, Tosteson TD. Assessment of cancer risk and environmental levels of arsenic in New Hampshire. Int J Hyg Environ Health. 2002;205:85–94. - PubMed
    1. Abernathy COLY, Longfellow D, Aposhian HV, Beck B, Fowler B, Goyer R, Menzer R, Rossman T, Thompson C, Waalkes M. Arsenic: health effects, mechanisms of actions, and research issues. Environ Health Perspect. 1999:593–597. - PMC - PubMed
    1. Liu Z, Shen J, Carbrey JM, Mukhopadhyay R, Agre P, Rosen BP. Arsenite transport by mammalian aquaglyceroporins AQP7 and AQP9. Proc Natl Acad Sci U S A. 2002;99:6053–6058. - PMC - PubMed

Publication types