. 2006 Dec 15;2(12):e212.
doi: 10.1371/journal.pgen.0020212. Epub 2006 Nov 1.

Global mapping of transposon location

Affiliations

Global mapping of transposon location

Abram Gabriel et al. PLoS Genet. .

Abstract

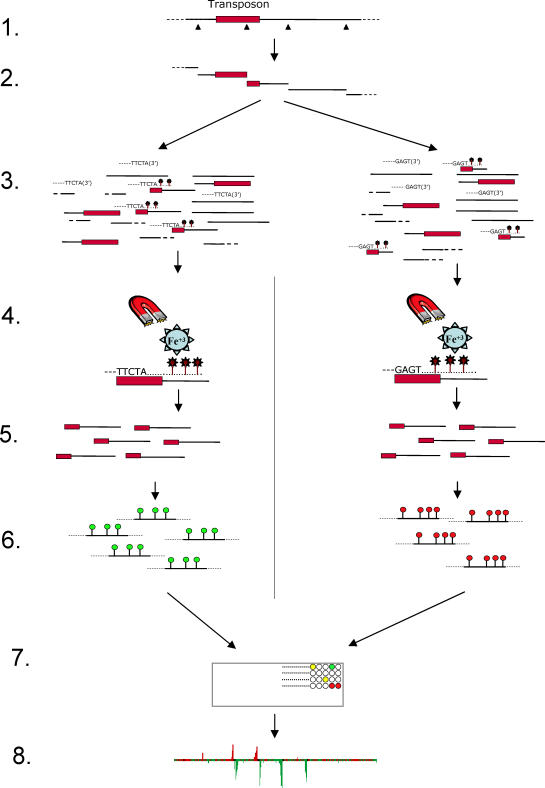
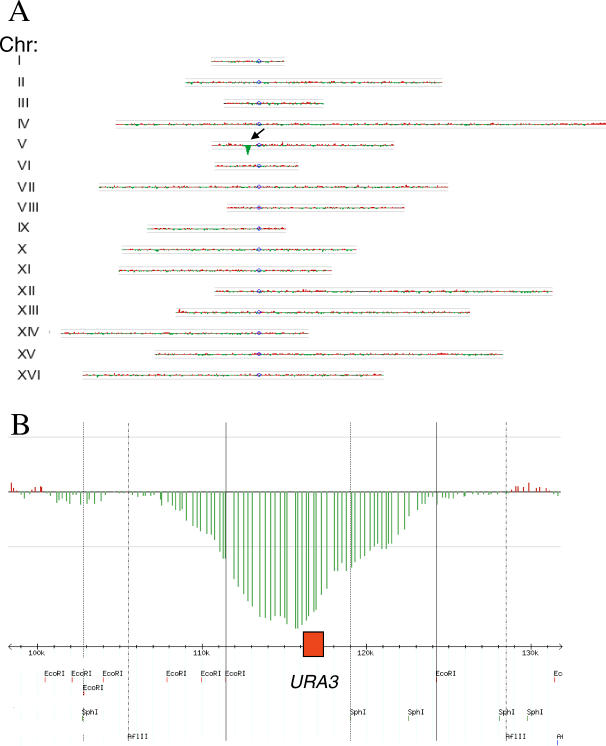
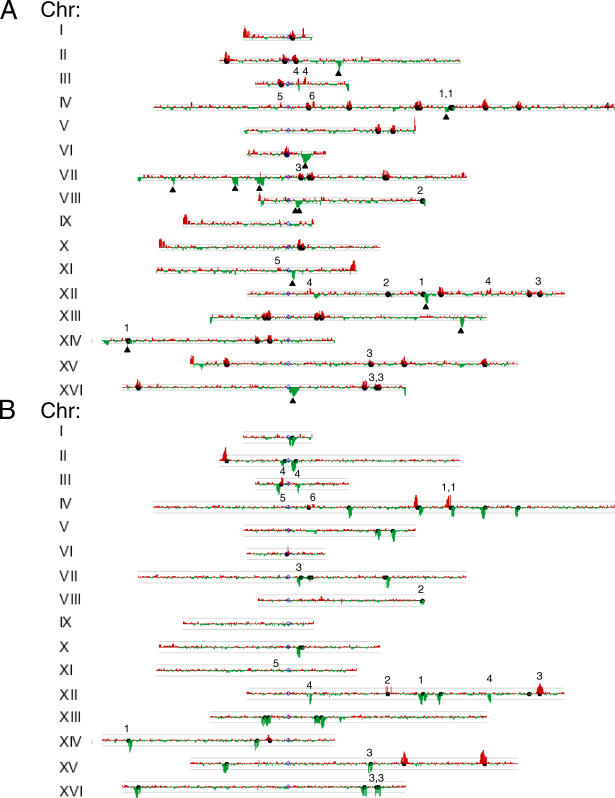
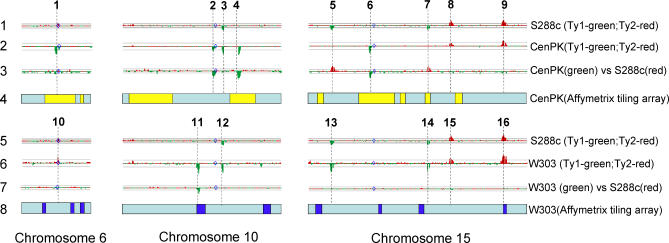
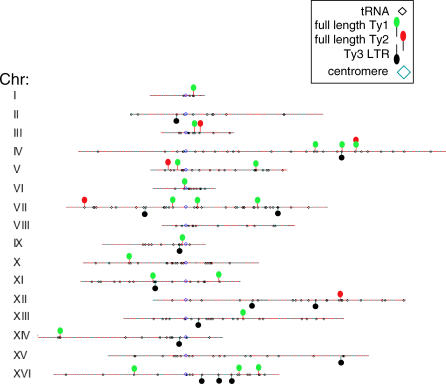
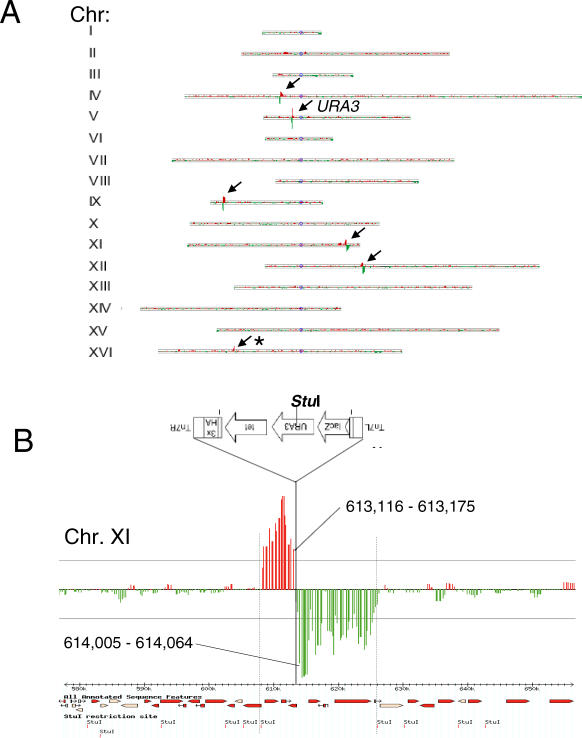
Transposable genetic elements are ubiquitous, yet their presence or absence at any given position within a genome can vary between individual cells, tissues, or strains. Transposable elements have profound impacts on host genomes by altering gene expression, assisting in genomic rearrangements, causing insertional mutations, and serving as sources of phenotypic variation. Characterizing a genome's full complement of transposons requires whole genome sequencing, precluding simple studies of the impact of transposition on interindividual variation. Here, we describe a global mapping approach for identifying transposon locations in any genome, using a combination of transposon-specific DNA extraction and microarray-based comparative hybridization analysis. We use this approach to map the repertoire of endogenous transposons in different laboratory strains of Saccharomyces cerevisiae and demonstrate that transposons are a source of extensive genomic variation. We also apply this method to mapping bacterial transposon insertion sites in a yeast genomic library. This unique whole genome view of transposon location will facilitate our exploration of transposon dynamics, as well as defining bases for individual differences and adaptive potential.


Conflict of interest statement

Competing interests. Some reagents were the gift of Qiagen and others were the gift of Generation Biotech. One author (JD) is the founder of Generation Biotech and an inventor of haplotype-specific extraction (United States 2001–0031467 A1). Qiagen has licensed the commercial rights to haplotype-specific extraction products from Generation Biotech. AG, JD, and MJD have applied for a patent based on this work.

Figures

Figure 1
Figure 1. A General Schematic Diagram of the Steps Involved in Extracting, Labeling, and Identifying the Position of Transposons within a Genome
Step 1. Genomic DNA is digested with a restriction endonuclease containing a cut site (triangle) within the transposon (red box). This results in multiple restriction fragments, including ones containing transposon and contiguous flanking DNA. Step 2. Digested DNA (which may be pooled from multiple separate digests) is mixed with oligonucleotide probes that have been designed to anneal to specific sequences within the transposon. Separate probe sets anneal to different transposons (as shown), or separate genomic DNA samples are used to compare transposon content from different sources. Step 3. After heat denaturation and reannealing, the mixture is incubated in the presence of a DNA polymerase and dNTPs, one of which is biotinylated (stick with star atop it). This allows specific extension from the annealed 3′ probe termini. Step 4. Extended probes and their annealed templates are purified away from the mixture using magnetic streptavidin-coated beads (star labeled with Fe+3). Step 5. The extracted templates are released by heating. Step 6. The templates are labeled using Cy3- or Cy5-labeled nucleotides (green and red lollipops, respectively) in the presence of random primers and a DNA polymerase. Step 7. Differentially labeled DNAs are hybridized to a microarray slide with features distributed throughout the genome. After washing, the array is scanned to identify features (circles) that are common to both DNA sources (yellow circles) or that have been differentially extracted (green or red circles). Step 8. The log2 ratio of signal intensity for the two dyes is quantitated and graphically represented along each chromosome to identify contiguous segments of differential signal that correspond to the DNA flanking the original transposons.
Figure 2
Figure 2. Identifying a Unique Ty1 Element in Otherwise Isogenic Strains
(A) Two isogenic yeast strains (FY5 and FY2) differ only by the presence of a Ty1 insertion in Chromosome V within the URA3 gene in FY2. After labeling transposon extracted DNA from FY2 with Cy3 (green) and transposon extracted DNA from FY5 with Cy5 (red), the labeled DNA was hybridized to an Agilent yeast whole genome microarray with >40,000 unique features (yeast repetitive DNA was avoided during array construction). Log2 ratio of hybridization for each feature along each chromosome is shown plotted in genome order using the TreeView Karyoscope function. The one region of significant differential hybridization is marked with an arrow. The grey horizontal lines above and below each chromosome correspond to 3-fold differential hybridization intensity. (B) Zoom view of a portion of Chromosome V and the peak of differential hybridization corresponding to the ∼8 kb surrounding URA3 (red box). The positions of nearby restriction sites for the enzymes used initially to digest genomic DNA are shown based on a GBrowse view of the region from SGD.
Figure 3
Figure 3. Validation of Whole Genome Transposon Analysis Using Two Sequenced Strains of S. cerevisiae
(A) Whole genome comparison of full-length Ty1 and Ty2 elements from yeast strains RM11 and S288c after hybridization to the same Agilent yeast whole genome microarray. Black circles indicate the position of Ty1 or Ty2 full-length elements annotated for S288c in SGD. Triangles indicate full-length Ty2 elements identified in the sequence of RM11. Red peaks correspond to potential Ty1 or Ty2 elements present in S288c, while green peaks correspond to potential Ty1 or Ty2 peaks present in RM11. (B) Comparison of location of Ty1 full-length elements (green) and Ty2 full-length elements present in S288c. Symbols are as above. Numbers above various peaks refer to the following: 1, false-negative S288c elements obscured by overlapping elements in RM11; 2, false-negative S288c elements located in regions that are poorly represented by features on the array; 3, false-negative S288c elements that missed the criteria for calling a peak; 4, unannotated Ty1 full-length elements in S288c confirmed in this study; 5, false-positive peaks due to borderline elevated differential hybridization; 6, false-positive peaks corresponding to non-Ty repetitive elements in the genome. Grey horizontal lines above and below the central line for each chromosome correspond to a 3-fold difference in normalized ratio of Cy5 and Cy3 signal intensity.
Figure 4
Figure 4. Comparison of Full-Length Ty1 and Ty2 Elements on Chromosomes VI, X, and XV in Strains S288c, CEN.PK, and W303
Rows 1, 2, 3, 5, 6, and 7 are based on transposon extraction data from Agilent yeast whole genome microarrays. Rows 4 and 8 correspond to Affymetrix tiling arrays probed with either CEN.PK DNA or W303 genomic DNA. For rows 1, 2, 5, and 6, digested genomic DNA as noted was extracted with either Ty1-specific or Ty2-specific sets of probes. For rows 3 and 7, digested genomic DNA was extracted with the set of common Ty1 and Ty2 probes. Numbers above vertical dashed lines refer to examples of transposon insertions of interest. Grey horizontal lines above and below the central line for each chromosome correspond to a 3-fold ratio of signal intensity. In rows 4 and 8, pale blue rectangles correspond to regions of CEN.PK and W303, respectively, derived from its S288c parent. In row 4, yellow rectangles correspond to regions of CEN.PK derived from its non-S288c parent. In row 8, dark blue rectangles correspond to regions of W303 derived from its non-S288c parent.
Figure 5
Figure 5. Transposon Map of SK1
The positions of Ty1 and Ty2 full-length elements and Ty3 LTR elements in strain SK1 are shown, based on Agilent yeast whole genome microarray (Ty1 and Ty2) and Agilent ORF array (Ty3 LTR) analysis of this uncharacterized genome.
Figure 6
Figure 6. Analysis of Modified Bacterial (“Artificial”) Transposon Insertions in the S. cerevisiae Genome
(A) Positions of five independent pooled artificial transposons from a yeast insertion library were determined after extracting StuI-digested yeast genomic DNA with probes designed to correspond to either strand at the 5′ or 3′ end of URA3, labeling with Cy3 and Cy5, respectively, and hybridizing to an Agilent yeast whole genome microarray. Arrows signify locations of significant differential hybridization. “URA3” indicates the actual URA3 locus on Chromosome V. The asterisk indicates an insertion on Chromosome XVI in which only the flanking region 3′ to the transposon is detected. Vertical lines above and below the horizontal for each chromosome represent the log2 ratio of hybridization intensity for Cy5 versus Cy3 at each feature along the Agilent yeast whole genome microarray. For each insertion, the actual insertion site, determined by sequencing, and the position of the first significant flanking features are as follows: Chromosome IV, 368020, and 367656–367715 and 368589–368648; Chromosome IX, 55576, and 55291–55350 and 55808–55867; Chromosome XI, 613654, and 612706–612765 and 614005–614064; Chromosome XII, 387226, and 386346–386405 and 387248–387307; and Chromosome XVI, 296609, and 296350–296409 to 297592–297651. (B) An enlargement of the region detected on Chromosome XI, showing the structure of the artificial transposon, its unique StuI site, the bases covered by the oligonucleotides in the features on either side of the transition from significant differential Cy5 labeling to Cy3 labeling, and the position of the actual insertion. The map of the region from GBrowse of SGD shows the position of StuI restriction sites in the region. Grey horizontal lines above and below the central line for each chromosome correspond to a 3-fold ratio of signal intensity. Note that the transposon inserted in opposite orientation relative to the chromosome numbering, and is therefore flipped in the figure.

Similar articles

Cited by

References

    1. Kazazian HH., Jr Mobile elements and disease. Curr Opin Genet Dev. 1998;8:343–350. - PubMed
    1. Engels WR. P elements in Drosophila . Curr Top Microbiol Immunol. 1996;204:103–123. - PubMed
    1. Kim JM, Vanguri S, Boeke JD, Gabriel A, Voytas DF. Transposable elements and genome organization: A comprehensive survey of retrotransposons revealed by the Saccharomyces cerevisiae genome sequence. Genome Res. 1998;8:464–478. - PubMed
    1. Bennetzen JL. Transposable element contributions to plant gene and genome evolution. Plant Mol Biol. 2000;42:251–269. - PubMed
    1. Bushman FD. Targeting survival: Integration site selection by retroviruses and LTR-retrotransposons. Cell. 2003;115:135–138. - PubMed

Publication types

MeSH terms

Substances

Associated data