Review
. 2007 Feb;53(2):337-43.
doi: 10.1016/j.brainresrev.2006.11.001. Epub 2006 Dec 14.

Phosphene induction by microstimulation of macaque V1

Affiliations
Review

Phosphene induction by microstimulation of macaque V1

Edward J Tehovnik et al. Brain Res Rev. 2007 Feb.

Abstract

Non-human primates are being used to develop a cortical visual prosthesis for the blind. We use the properties of electrical microstimulation of striate cortex (area V1) of macaque monkeys to make inferences about phosphene induction. Our analysis is based on well-established properties of V1: retino-cortical magnification factor, receptive-field size, and the characteristics of hypercolumns. We argue that phosphene size is dependent on the amount of current delivered to V1 and on the retino-cortical magnification factor. We suggest that to improve the correspondence between the site of stimulation within V1 and the visual field location of an elicited phosphene both eyes must be put under experimental control given that phosphene location is retinocentric and given that the vergence angle between the eyes might affect the position of a phosphene in depth. Knowing how electrical microstimulation interacts with cortical tissue to evoke percepts in behaving macaque monkeys is fundamental to the establishment of an effective cortical visual prosthesis for the blind.


Figures
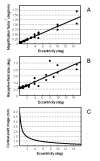
Figure 1
Figure 1
(A) Inverse magnification factor is plotted as a function of visual field eccentricity for V1 of macaque monkeys. Data were obtained from Talbot and Marshall (1941), Daniel and Whitteridge (1961), Hubel and Wiesel (1974), Dow et al. (1981), Tootell et al. (1982), and Dagnelie et al. (1989). A regression line (i.e. inverse magnification factor = 0.085 × eccentricity + 0.055) was fitted to the data (R2 = 0.92, N = 39). (B) Receptive-field size is plotted as a function of visual field eccentricity for V1 of macaque monkeys. Data were obtained from Hubel and Wiesel (1974), Schiller et al. (1976), Dow et al. (1981), van Essen et al. (1984), and Dagnelie et al. (1989). A regression line (i.e. receptive-field size = 0.051 × eccentricity + 0.214) was fitted to the data (R2 = 0.77, N = 24). (C) Cortical-point image is plotted as a function of visual field eccentricity for V1 of macaque monkeys. Cortical-point image is the produce of magnification factor and receptive-field size for a given visual field eccentricity. The function was derived from A and B by multiplying 1/(0.085 × eccentricity + 0.055) by (0.051 × eccentricity + 0.214) for a particular visual field eccentricity.
Figure 2
Figure 2
(A) Visual field size represented by activating V1 using a range of currents (3 to 169 μA) is plotted as a function of visual field eccentricity coded by the site of stimulation. We know that a 169 μA current directly activates 1 mm of V1 tissue [using the current-distance equation for effective radial, current spread (in mm) from an electrode tip: r = ( I/K ) 1/2, where I is current (in μA) and K = 675 μA /mm2; see Tehovnik et al. (2006) for details]. The function in the figure for 169 μA was derived from Fig. 1A, which indicates the amount of visual field represented by a 1 mm region of tissue in V1. Functions for the remaining currents (3 to 100 μA) represent a fraction of the visual field activated by 169 μA. This fraction was determined for each current by noting the amount of tissue activated at these current levels using the current-distance equation from above. The fraction of visual field activated was 0.134 0.188, 0.278, 0.386, 0.544, and 0.770 for 3, 6, 13, 25, 50, and 100 μA, respectively. To show that the estimates are reasonable, functions for the size of a delay field produced using 50 and 100 μA are shown (a and b, respectively). Notice that these functions overlap with the 50 and 100 μA lines. (B) Same plot as in A. The receptive-field size of V1 neurons is plotted as a function of visual field eccentricity coded by the site of stimulation (a). Data obtained from Fig. 1B. (C) Two ocular dominance columns are illustrated for macaque V1. Using the current-distance equation in A, effective current spread for 25 μA or less is shown by the gray circles to be confined to a 0.5 mm ocular dominance column, which represents the approximate width of such a column (Hubel and Wiesel, 1972; Hubel and Freeman, 1977; LeVay et al., 1985; Blasdel and Salama, 1986; Tootell et al., 1988a; Horton and Hocking, 1996). Layers I through VI are indicated in the figure. (D) Effective current spread is shown by the gray circles for 50 and 100 μA in a hypercolumn. (E) Size of a hypercolumn looking at the surface of V1 is illustrated. The black circles represent cytochrome oxidase patches spaced by 0.5 mm when situated between two adjacent ocular dominance stripes and spaced by 0.7 mm when situated within a stripe (Blasdel and Salama, 1986).

References

    1. Albrecht DG, Hamilton DB. Striate cortex of monkey and cat: contrast response function. J. Neurophysiol. 1982;48:217–237. - PubMed
    1. Bak M, Girvin JP, Hambrecht FT, Kufta CV, Loeb GE, Schmidt EM. Visual sensations produced by intracortical microstimulation of the human occipital cortex. Med. Biol. Eng. Comput. 1990;28:257–259. - PubMed
    1. Bartlett JR, DeYoe EA, Doty RW, Lee BB, Lewine JD, Negrão N, Overman WH., Jr. Psychophysics of electrical stimulation of striate cortex in macaques. J. Neurophysiol. 2005;94:3430–3442. - PubMed
    1. Bierer JA, Middlebrooks JC. Auditory cortical images of cochlear-implant stimuli: dependence on electrode configuration. J. Neurophysiol. 2002;87:478–492. - PubMed
    1. Bierer JA, Middlebrooks JC. Cortical responses to cochlear implant stimulation: channel interactions. J. Ass. Res. Otolaryngol. 2004;5:32–48. - PMC - PubMed

Publication types

LinkOut - more resources