Comparative Study
. 2008 Apr;29(4):514-23.
doi: 10.1016/j.neurobiolaging.2006.11.010. Epub 2006 Dec 14.

Detection of prodromal Alzheimer's disease via pattern classification of magnetic resonance imaging

Affiliations
Comparative Study

Detection of prodromal Alzheimer's disease via pattern classification of magnetic resonance imaging

Christos Davatzikos et al. Neurobiol Aging. 2008 Apr.

Abstract

We report evidence that computer-based high-dimensional pattern classification of magnetic resonance imaging (MRI) detects patterns of brain structure characterizing mild cognitive impairment (MCI), often a prodromal phase of Alzheimer's disease (AD). Ninety percent diagnostic accuracy was achieved, using cross-validation, for 30 participants in the Baltimore Longitudinal Study of Aging. Retrospective evaluation of serial scans obtained during prior years revealed gradual increases in structural abnormality for the MCI group, often before clinical symptoms, but slower increase for individuals remaining cognitively normal. Detecting complex patterns of brain abnormality in very early stages of cognitive impairment has pivotal importance for the detection and management of AD.


Figures
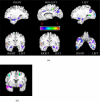
Fig.1
Fig.1
Representative cross-sections highlighting the brain regions that collectively form a spatial pattern of brain atrophy that is highly indicative of MCI. The color-coding shows relative importance of a structure. The regions in (a) were located in areas known to be implicated in AD. The superior and middle frontal WM clusters in (b) were unexpected and must be further investigated via methods particularly suitable for WM structures, such as diffusion tensor imaging.
Fig.2
Fig.2
ROC plots showing the trade-off between specificity and sensitivity in MRI-based detection of MCI. For each point on the ROC, the overall accuracy is shown in blue numbers (0.90 = 90%).
Fig.3
Fig.3
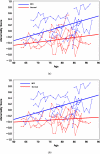
Longitudinal change in the degree of structural abnormality measured by applying the pattern classification technique retrospectively to scans prior to the year in which the scans of healthy individuals and MCI patients were analyzed. Solid lines show estimates of the mean longitudinal changes for the two groups, derived from a mixed effects regression model. The faster increase of the abnormality score in the individuals who develop MCI reflects an important finding of this study: structural changes occur at very early stages, and they can be detected via the pattern classification technique applied in this study. (a) All participants; (b) After excluding one clinically normal participant who showed an unusually steep increase in abnormality score over time and subsequently was found to have pathology consistent with Alzheimer's disease despite normal clinical status.
Fig.4
Fig.4
Scatterplots of the volumes of the hippocampus (horizontal) and entorhinal cortex (vertical), after dividing each measurement by the respective total intra-cranial volume. Although these two structures are known to be significantly affected by Alzheimer's Disease, their volumes are of relatively modest diagnostic value, due to the overlap of the two distributions.
Fig. 5
Fig. 5
ROC curve of the classification sensitivity and specificity obtained by using the volumes of the hippocampus and the entorhinal cortex jointly, in conjunction with a nonlinear support vector machine classifier. The resultant diagnostic accuracy is very limited, compared to that of Fig. 2.
Fig. 6
Fig. 6
Predictive accuracy as a function of the number of brain regions/clusters included in the classification process. Small number of regions is insufficient, whereas more than 30 regions result in insufficient training of the classifier, as we had 30 samples; this is the well-known “curse of dimensionality” in machine learning, and indicates that more extensive image databases might ultimately improve classification accuracy.

References

    1. Ashburner J, Csernansky JG, Davatzikos C, Fox NC, Frisoni GB, Thompson PM. Computer-assisted imaging to assess brain structure in healthy and diseased brains. The Lancet (Neurology) 2003;2(2):79–88. - PubMed
    1. Bobinski M, de Leon MJ, Convit A, De Santi S, Wegiel J, Tarshish CY, Saint Louis LA, Wisniewski HM. MRI of entorhinal cortex in mild Alzheimer's disease. Lancet. 1999;353(9146):38–40. - PubMed
    1. Bookstein FL. ‘Voxel-Based Morphometry’ Should Not Be Used With Imperfectly Registered Images. Neuroimage. 2001;14:1454–62. - PubMed
    1. Braak H, Braak E, Bohl J, Bratzke H. Evolution of Alzheimer's disease related cortical lesions. J Neural Transm Suppl. 1998;54:97–106. - PubMed
    1. Chetelat G. Early diagnosis of Alzheiner's Disease: contribution of structural neuroimaging. Neuroimage. 2003;18(2):525–41. - PubMed

Publication types

MeSH terms