Comparative Study
. 2007 Mar;84(3):473-85.
doi: 10.1016/j.exer.2006.10.016. Epub 2006 Dec 18.

Targeted inactivation of synaptic HRG4 (UNC119) causes dysfunction in the distal photoreceptor and slow retinal degeneration, revealing a new function

Affiliations
Comparative Study

Targeted inactivation of synaptic HRG4 (UNC119) causes dysfunction in the distal photoreceptor and slow retinal degeneration, revealing a new function

Yasutsugu Ishiba et al. Exp Eye Res. 2007 Mar.

Abstract

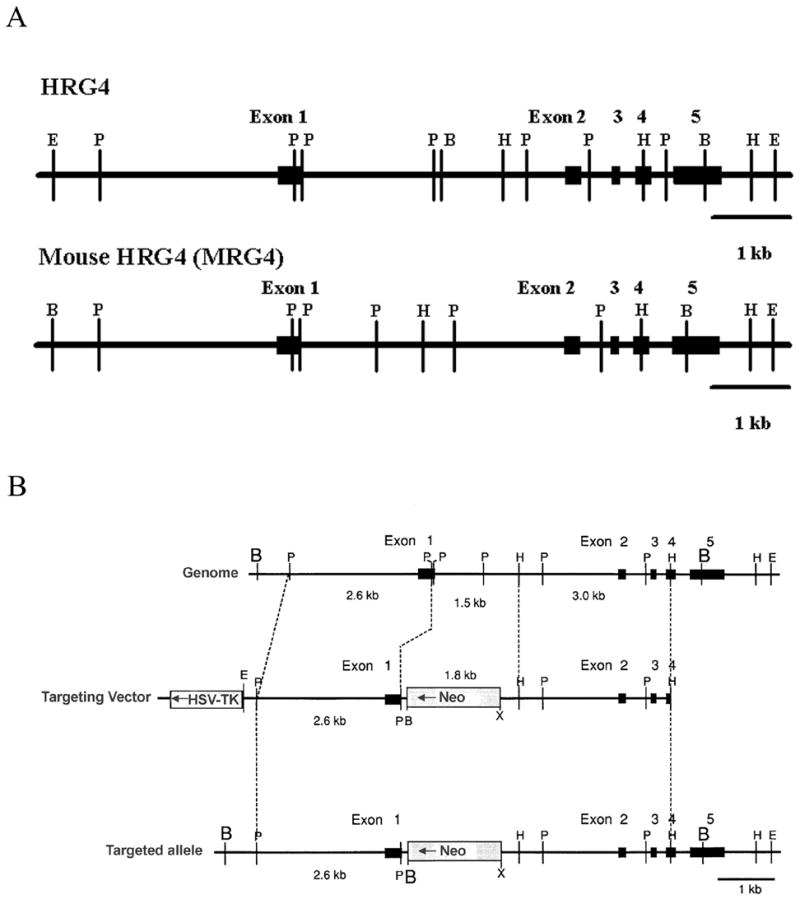
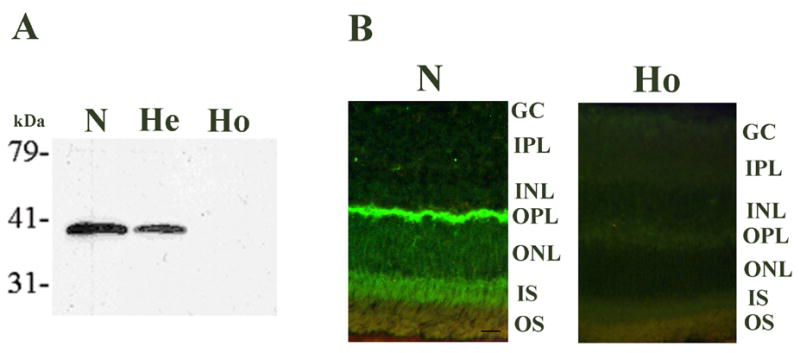
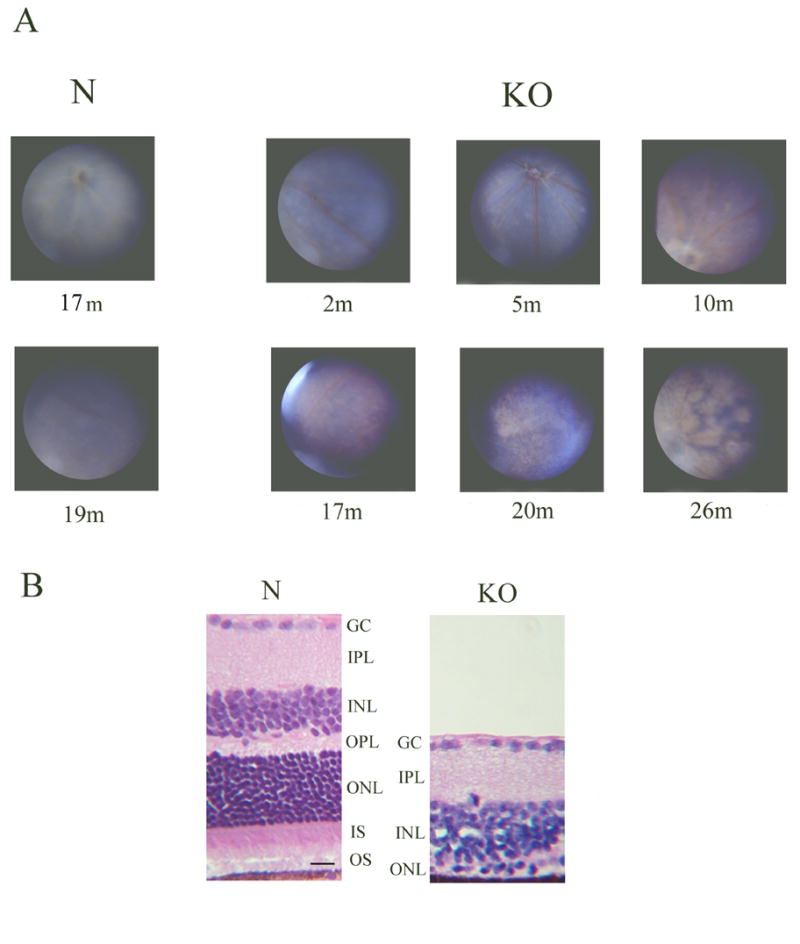
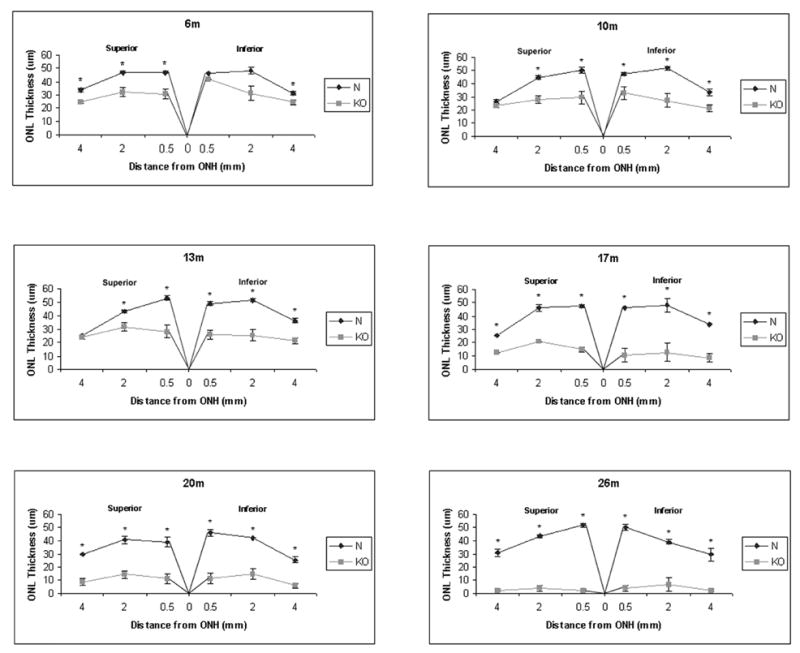
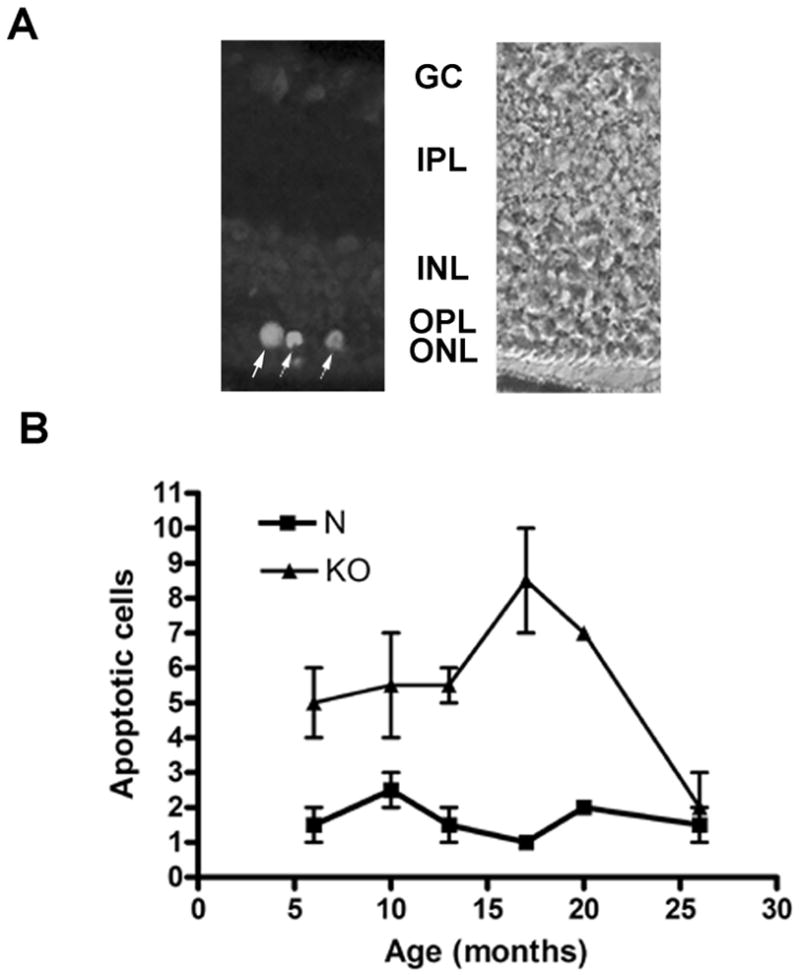
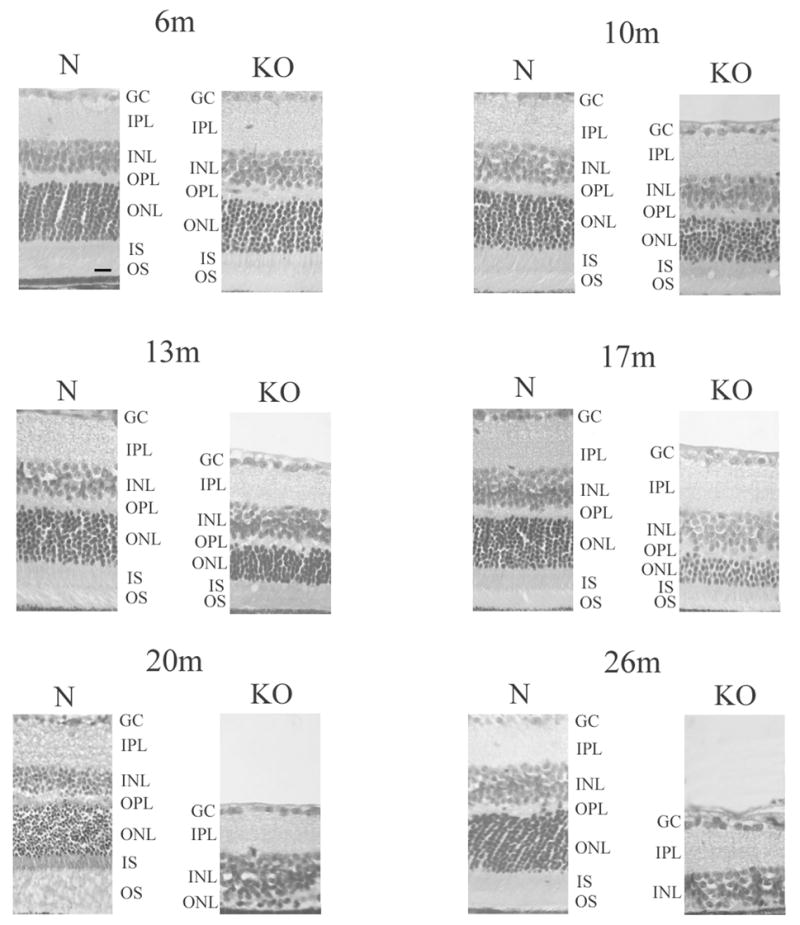
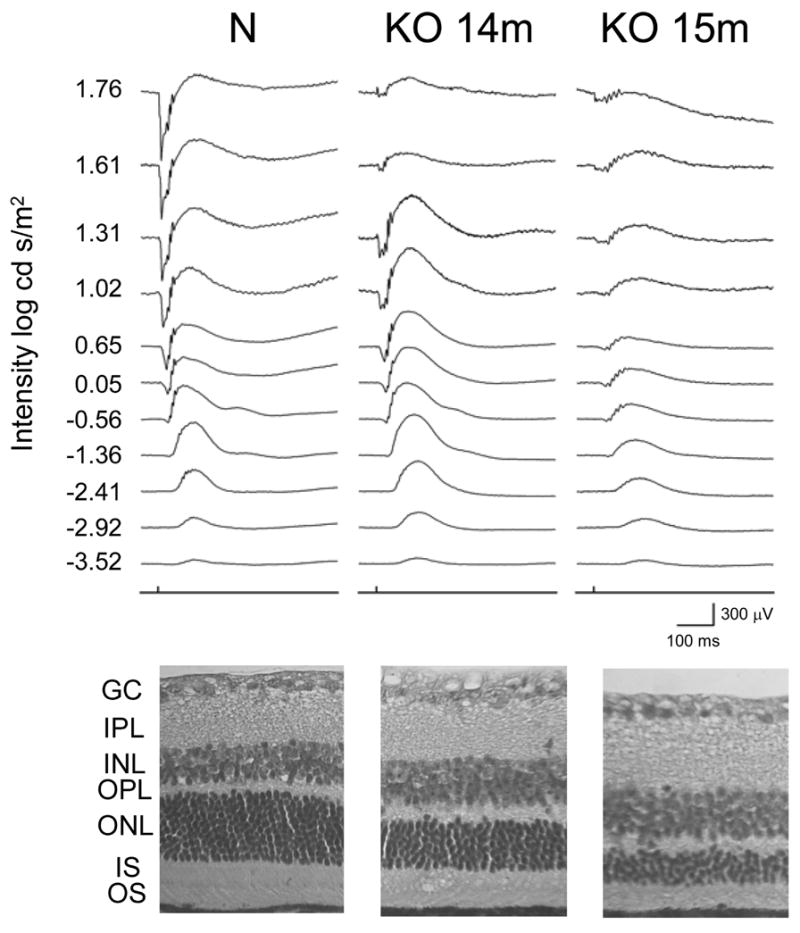
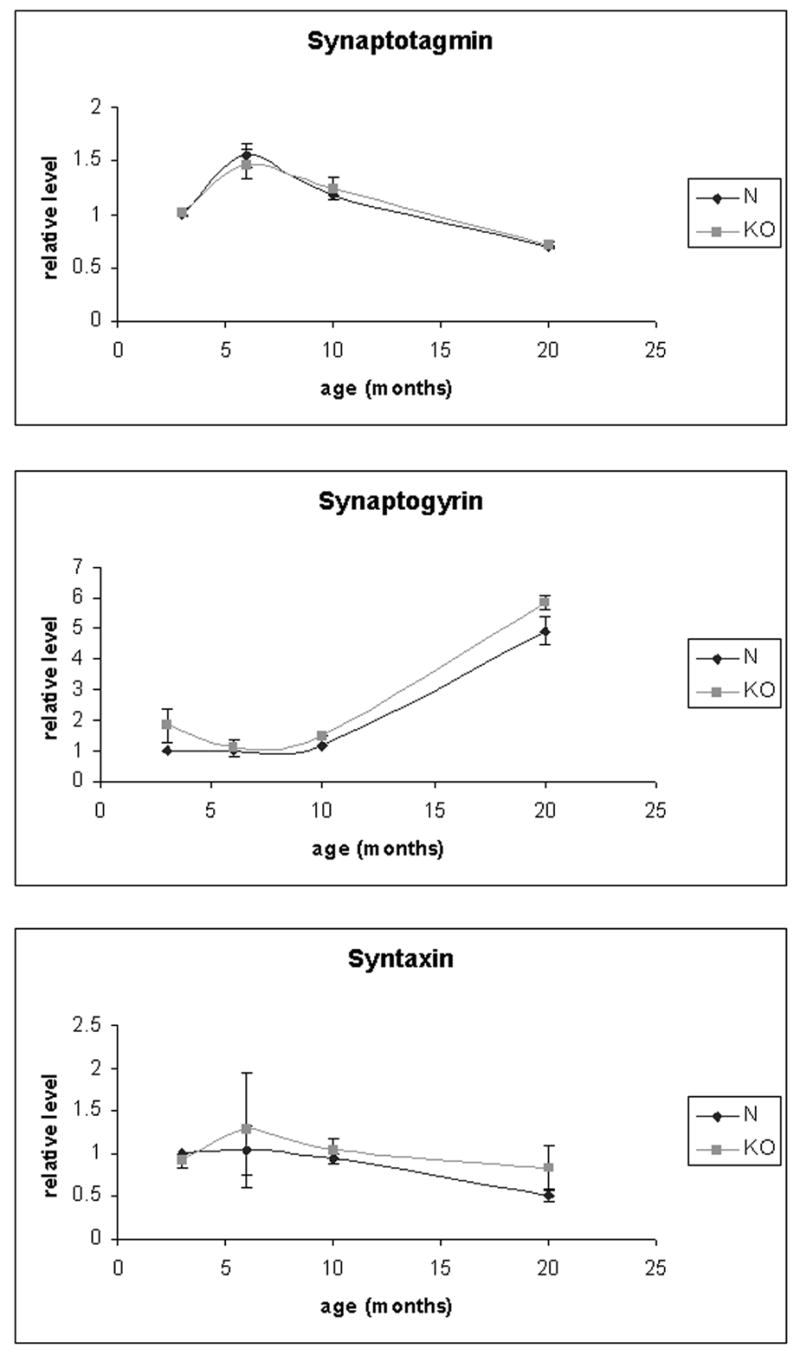
HRG4 (UNC119) is a photoreceptor protein predominantly localized to the photoreceptor synapses and to the inner segments to a lesser degree. A heterozygous truncation mutation in HRG4 was found in a patient with late onset cone-rod dystrophy, and a transgenic (TG) mouse expressing the identical mutant protein developed late onset retinal degeneration, confirming the pathogenic potential of HRG4. Recently, the dominant negative pathogenic mechanism in the TG model was shown to involve increased affinity of the truncated mutant HRG4 for its target, ARL2, which leads to a delayed decrease in its downstream target, mitochondrial ANT1, mitochondrial stress, synaptic degeneration, trans-synaptic degeneration, and whole photoreceptor degeneration by apoptosis. In this study, the mouse HRG4 (MRG4) gene was cloned and targeted to construct a knock-out (KO) mouse model of HRG4 in order to study the effects of completely inactivating this protein. The KO model was examined by genomic Southern blotting, Western blotting, immunofluorescence, funduscopy, LM and EM histopathology, ERG, and TUNEL analyses. The KO model developed a slowly progressive retinal degeneration, characterized by mottling in the fundus, mild thinning of the photoreceptor layer, and increase in apoptosis as early as 6 months, dramatic acceleration at approximately 17 months, and virtual obliteration of the photoreceptors by 20 months. When compared to retinal degeneration in the TG model, significant differences existed in the KO consisting of more severe and early photoreceptor death without evidence of early synaptic and trans-synaptic degeneration as seen in the TG, confirmed by LM and EM histopathology, ERG, and Western blotting of synaptic proteins. The results indicated a dysfunction in the KO outside the synapses in the distal end of photoreceptors where MRG4 is also localized. Differences in the phenotypes of retinal degeneration in the KO and TG models reflect a dysfunction in the two opposite ends of photoreceptors, i.e., the distal inner/outer segments and proximal synapses, respectively, indicating a second function of MRG4 in the distal photoreceptor and dual functionality of MRG4. Thus, inactivation of MRG4 by gene targeting resulted in a retinal degeneration phenotype quite different from that previously seen in the TG, attesting to the multiplicity of MRG4 function, in addition to the importance of this protein for normal retinal function. These models will be useful in elucidating the functions of HRG4/MRG4 and the mechanism of slow retinal degeneration.


Figures

Figure 1
Figure 1
Structure and targeting of the mouse HRG4 (MRG4) gene. A. Exon/intron sturcture of the MRG4 gene (bottom) is compared to that of the human HRG4 gene (top). The mouse gene, like the human gene, consists of 5 exons encompassing ~5 kbp of genomic sequence. Exons are represented by black boxes and labeled. Restriction enzyme sites are shown by letters. B, Bam HI; P, Pst I; H, Hind III; E, Eco RI. B. Targeting of the MRG4 gene. Targeting of the MRG4 gene (top) by the pPNT targeting vector (middle) is shown. The resulting targeted gene is shown at the bottom. The targeting vector contains a neomycin resistance gene in a ~7 kbp sequence homologous to the mouse genomic region containing the upstream region and exons 1 to 4 of the MRG4 gene. A herpes simplex virus thymidine kinase (HSV-TK) gene is also attached at one end of the homologous region in the vector to facilitate the selection of successfully targeted cells. Correct targeting of the vector should result in elimination of this marker. Successful targeting results in replacement of part of exon 1 and intron 1 with the neomycin resistance gene-containing sequence (bottom). A termination codon is built into the sequence downstream of exon 1 to prevent run-on translation. Restriction enzyme sites: B, Bam HI; P, Pst I; H, Hind III; E, Eco RI; X, Xho I. Neo, neomycin resistance gene. HSV-TK, herpes simplex virus thymidine kinase gene. Gene exons are represented by black boxes.
Figure 2
Figure 2
Confirmation of the MRG4 gene targeting in the knock-out mouse. A. Western blot analysis of retinal proteins from normal (N), heterozygous (He), and homozygous (Ho) knockout mouse with the rat HRG4 (RRG4) antibody (1:200). A strongly reactive MRG4 protein band is present in the normal retina (N), whereas a band approximately half as reactive is present in the heterozygous retina (He), consistent with one allele being knocked out by targeting, and a complete absence of the protein band in the homozygous retina (Ho), consistent with both alleles being knocked out. Protein size markers are shown on the left. kDa, kilo Daltons. B. MRG4 immunofluorescence (polyclonal anti-rat HRG4 (RRG4) antibody, 1:100) in 12 months old normal (N) and homozygous knock-out mouse (Ho) retinas. The presence of MRG4, predominantly in the outer plexiform layer and less in the inner segments of the retina, is shown in the normal retina (N). There is complete absence of MRG4 signal in the homozygous knockout mouse retina (Ho). There is evidence of retinal degeneration visible in the homozygous knock-out mouse, i.e., thinning of the outer nuclear layer compared to normal thickness. GC, ganglion cell layer; IPL, inner plexiform layer; INL, inner nuclear layer; OPL, outer plexiform layer; ONL, outer nuclear layer; IS, inner segments; OS, outer segments. Scale bar in N = 10 micrometer.
Figure 3
Figure 3
Fundus images of the homozygous knock-out mouse and histologic confirmation of retinal degeneration. A. Fundus photographs of 17 and 19 months old normal mice (N) and 2, 5, 10, 17, 20, and 26 months old homozygous KO mice are shown. The fundus photographs were taken with the Kowa RC2 camera. No significant abnormality is present in the KO fundus at 2 months of age, but mottling of the RPE begins to appear in all areas of the retina at 5 months of age. The mottling increases in area and begins to coalesce, and blood vessels begin to narrow by 10 months. The entire retina is involved and areas of retinal thinning are visible by 17 months of age. By 20 to 26 months, severe retinal degeneration affecting the entire retina is seen. No abnormality is seen in the fundus of 17 and 19 months old normal mice (N). B. Histopathology of normal (N) and homozygous KO mouse retina at 20 months of age. H&E stained sections of mid retina are shown. Severe retinal degeneration is present in the KO retina with barely a single row of photoreceptor nuclei left (ONL), consistent with the fundus image obtained. GC, ganglion cell layer; IPL, inner plexiform layer; INL, inner nuclear layer; OPL, outer plexiform layer; ONL, outer nuclear layer; IS, inner segments; OS, outer segments. Scale bar in N = 10 micrometer.
Figure 4
Figure 4
Morphometric analysis of normal and KO retinas at different ages. Thickness in μm of the outer nuclear layer (ONL) containing the photoreceptors is shown for normal (N) and homozygous KO retinas at 6, 10, 13, 17, 20, and 26 months of age. For each measurement, ONL thickness was determined at a point 0.5, 2, and 4 mm from the optic nerve head (ONH) superior or inferior in a vertical meridian section of the retina stained with H&E. Each point on the graph represents an average of measurements from 3–4 animals, and error bars represent standard error of means. Asterisk indicates statistically significant difference between the normal and KO ONL thickness at p<0.05. The results demonstrate a pattern of progressive retinal degeneration in the KO retina, consisting of thinning of the ONL which follows a relatively slow and steady pace until 17 months of age when it accelerates dramatically to result in barely a single row of photoreceptor nuclei left by 20 months of age. No difference in the severity of degeneration is observed between the superior and inferior retina.
Figure 5
Figure 5
Apoptosis in normal and KO retinas at different ages. A. Immunofluorescence (Alexa Fluor 488) of TUNEL-positive photoreceptor cells (arrows) is shown in 20 months old KO retina (left) with corresponding phase image (right). Most of the photoreceptors in the outer nuclear layer is degenerated except for 1–2 rows of nuclei. GC, ganglion cell layer; IPL, inner plexiform layer; INL, inner nuclear layer; OPL, outer plexiform layer; ONL, outer nuclear layer. B. A graph of number of TUNEL-positive apoptotic cells in KO and normal (N) (sibling) retinas at different ages is shown. Each point represents the average number of TUNEL-positive photoreceptors present in a microscopic section (vertical meridian) spanning the whole retina from three normal or homozygous KO mice of specified age. An increase in number of apoptotic cells is seen in the KO retina compared to normal as early as 6 months. An abrupt increase in apoptosis is seen in the KO retinas at 17–20 months, consistent with the acceleration of the retinal degeneration after 17 months demonstrated by the morphometric analysis. Error bars = standard error of means. The differences in the number of apoptotic cells between the normal and KO retinas were statistically significant (p<0.05) by the Student's t-test for all ages except 10 months.
Figure 6
Figure 6
Histopathology of the KO retina. H&E stained sections of retinas from normal (N) and homozygous KO mice at 6, 10, 13, 17, 20, and 26 months of age are shown. Progressive retinal degeneration is evident with gradual thinning of the outer nuclear layer containing the photoreceptors until 17 months of age when there is an acceleration of the degeneration, resulting in virtual disappearance of the photoreceptors by 20 and 26 months of age. The thickness of the inner nuclear layer does not appear to decrease much in the KO retina over time until the terminal stage at 26 months. The architecture of the outer nuclear layer appears to be maintained while it undergoes thinning in the KO retina. The histopathologic time course of retinal degeneration in the KO retina is consistent with the time course of changes seen in the funduscopic, morphometric, and apoptosis analyses. GC, ganglion cell layer; IPL, inner plexiform layer; INL, inner nuclear layer; OPL, outer plexiform layer; ONL, outer nuclear layer; IS, inner segments; OS, outer segments. Scale bar in 6m N = 10 micrometer.
Figure 7
Figure 7
ERG study of KO and control mice. The ERG of 14-month-old KO, 15-month-old KO (2 mice of each age), and control mice (one of each age) are shown with retinal morphology of the same mice. Abnormal ERG characterized by a reduction in both a- and b-wave at high light intensity is shown for the KO mice which worsens with age and correlates with the thinning of the photoreceptor layer (ONL). The ONL of the 14-month-old and 15-month-old KO is thinned to 5–8 rows and 3–5 rows of nuclei, respectively, compared to 10–12 rows for the normal control. GCL, ganglion cell layer; IPL, inner plexiform layer; INL, inner nuclear layer; OPL, outer plexiform layer; ONL, outer nuclear layer; IS, inner segments; OS, outer segments.
Figure 8
Figure 8
Western blot analysis of synaptic proteins in the KO and control retina. The protein levels of synaptotagmin, synaptogyrin, and syntaxin in the KO and normal control retinas at 3, 6, 10, and 20 months of age are shown. The levels of proteins were obtained by western blot analysis of total retinal proteins with the corresponding antibodies (duplicates), quantitated by densitometry of the ECL bands, and normalized to the average level of 3 months normal control as 1 for each protein. The error bars are standard error of means. There was no statistically significant difference between the KO and control for any of the tested age and protein.

Similar articles

Cited by

References

    1. Acland GM, Aguirre GD, Ray J, Zhang Q, Aleman TS, Cideciyan AV, Pearce-Kelling SE, Anand V, Zeng Y, Maguire AM, Jacobson SG, Hauswirth WW, Bennett J. Gene therapy restores vision in a canine model of childhood blindness. Nat Genet. 2001;28:92–95. - PubMed
    1. Bowes C, Li T, Danciger M, Baxter LC, Applebury ML, Farber DB. Retinal degeneration in the rd mouse is caused by a defect in the beta subunit of rod cGMP-phosphodiesterase. Nature. 1990;347:677–680. - PubMed
    1. Burns ME, Mendez A, Chen CK, Almuete A, Quillinan N, Simon MI, Baylor DA, Chen J. Deactivation of phosphorylated and nonphosphorylated rhodopsin by arrestin splice variants. J Neurosci. 2006;26:1036–1044. - PMC - PubMed
    1. Calvert PD, Krasnoperova NV, Lyubarsky AL, Isayama T, Nicolo M, Kosaras B, Wong G, Gannon KS, Margolskee RF, Sidman RL, Pugh EN, Jr, Makino CL, Lem J. Phototransduction in transgenic mice after targeted deletion of the rod transducin alpha -subunit. Proc Natl Acad Sci U S A. 2000;97:13913–13918. - PMC - PubMed
    1. Calvert PD, Govardovskii VI, Krasnoperova N, Anderson RE, Lem J, Makino CL. Membrane protein diffusion sets the speed of rod phototransduction. Nature. 2001;411:90–94. - PubMed

Publication types

MeSH terms

Substances