. 2007 Mar;185(1):94-102.
doi: 10.1016/j.jmr.2006.11.011. Epub 2006 Dec 18.

Nonlinear magnetic field gradients can reduce SAR in flow-driven arterial spin labeling measurements

Affiliations

Nonlinear magnetic field gradients can reduce SAR in flow-driven arterial spin labeling measurements

Kenneth I Marro et al. J Magn Reson. 2007 Mar.

Abstract

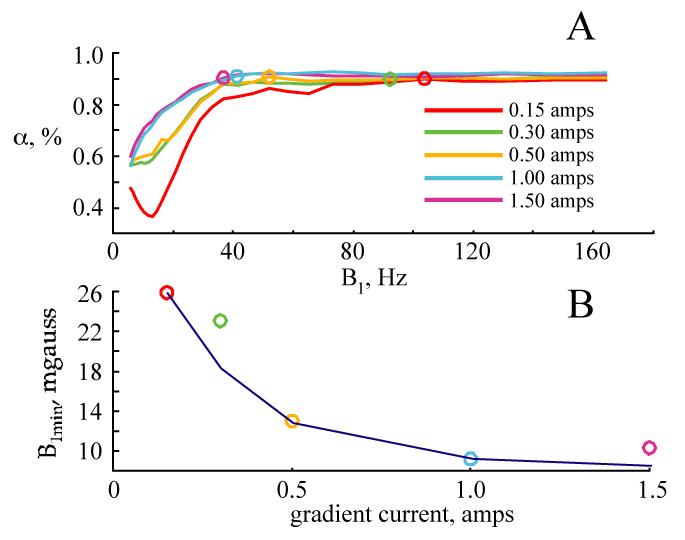
This work describes how custom-built gradient coils, designed to generate magnetic fields with amplitudes that vary nonlinearly with position, can be used to reduce the potential for unsafe tissue heating during flow-driven arterial spin labeling processes. A model was developed to allow detailed analysis of the adiabatic excitation process used for flow-driven arterial water stimulation with elimination of tissue signal (FAWSETS) an arterial spin labeling method developed specifically for use in skeletal muscle. The model predicted that, by adjusting the amplitude of the gradient field, the specific absorption rate could be reduced by more than a factor of 6 while still achieving effective labeling. Flow phantom measurements and in vivo measurements from exercising rat hind limb confirmed the accuracy of the model's predictions. The modeling tools were also applied to the more widely used continuous arterial spin labeling (CASL) method and predicted that specially shaped gradients could allow similar reductions in SAR.


Figures

Fig. 1
Fig. 1
This diagram shows the geometry of the gradient coil implemented in the FAWSETS flow phantom and in vivo measurements. The gradient was designed so that a 2.5 cm diameter by 2.5 cm long saddle coil, including the tune and match capacitors, could be centered inside it. The device consists of 10 conducting loops. Current in the dashed line elements flows in the opposite direction to that in the solid line elements. Spacing of the current loops is symmetric about the center-line (CL) of the gradient. Dimensions are given in mm. The device consisted of 20-gauge copper wire hand wound around a plexiglass tube. A custom-built, current-controlled power supply was used to drive the gradient. The power supply had a range of currents from −1.5 to +1.5 amps.
Fig. 2
Fig. 2
Fig. 2A shows the measured spatial variations in the ΔBo field with 5 different currents flowing through the custom-built gradient. The measured B1 field generated by our RF coil is also shown in Fig. 2A along with the axial sweet spot, defined as the region where B1 remains within 5% of maximum. Only the left-hand sides of the symmetric fields are shown and the 0 position corresponds to the center of the sweet spot of the RF coil. Figs. 2B through 2E show the intermediate calculations involved in the modeling and illustrate how gradient current affects the labeling process. Fig. 2B shows the spatial variations in the magnitude of Beff and Fig. 2C shows ϕ, the angle that Beff forms with the positive z-axis. Both Beff and ϕ were calculated directly from the B1 and ΔBo fields in Fig. 2A. Fig. 2D shows the time rate of change of ϕ assuming a constant flow velocity of 10 cm/s from left to right. Note that as gradient current increased the magnitude of Beff increased within the labeling slice and the curves for both ϕ and dϕ/dt shifted to the right. The net result of these two effects is that the peak value of the adiabaticity ratio, κ in Fig. 2E, decreased from about 0.6 to about 0.2 over the range of gradient currents tested. The key point of these graphs is that, for a fixed B1 field and velocity, optimizing the gradient current reduces the nominal amplitude of κ.
Fig. 3
Fig. 3
The top graph shows flow phantom measurements of the labeling efficiency, α, as a function of B1 amplitude with 5 different currents flowing through the custom-built gradient. As gradient current increased the curves for α shifted to the left, indicating that adiabatic conditions were being achieved with lower B1 amplitude. The color-coded circles on each curve mark B1min, or the minimum B1 amplitude required for α to reach 90%. In Fig. 3B we have plotted these same B1min data points as a function of gradient current. We used our modeling tools to generate the solid line in this graph, which shows the predicted B1 amplitude required to keep the maximum value of κ constant as the gradient current increased from 0.15 amps. The excellent agreement between the predicted and flow phantom results validates the assumptions and algorithms we used to develop our model. Both the measured and predicted results clearly show that, when the gradient current is optimized, adiabatic conditions can be achieved with lower B1 amplitude and hence lower SAR.
Fig. 4
Fig. 4
These curves are similar to the flow phantom results shown in Fig. 3A but summarize in vivo results obtained from the rat hind limb. To increase the perfusion signal, all the measurements were acquired at least 4 minutes after initiation of stimulated exercise so that perfusion had reached a relatively high steady state. While the data here are noisier, the pattern is the same as that seen in Fig. 3; as gradient current increased the curves shifted to the left. For these particular conditions, B1min decreased from about 530 Hz to less than 210 Hz as the gradient current increased from 0.30 to 1.50 amps.
Fig. 5
Fig. 5
These modeling results predict that optimizing the ΔBo field could also reduce SAR in CASL measurements. The parameters presented here are the same as those shown in Fig. 2. The dotted lines correspond to the conditions during a typical CASL labeling period; a uniform B1 amplitude of 170 Hz and a linear Bo gradient of 0.15 gauss/cm. The solid lines correspond to the same B1 field but a ΔBo field shaped specifically for flow-driven adiabatic inversion. The dashed lines correspond to the shaped ΔBo field and a uniform B1 field with the amplitude reduced to 65 Hz. (The solid line and the dashed line overlap in Figs. 5A and 5B.) In Fig. 5C the dotted line and the dashed line nearly overlap, indicating that when a B1 amplitude of 65 Hz is used in conjunction with the shaped ΔBo field, the thickness of the labeling slice is essentially the same as it is for a typical CASL measurement. Fig. 5E shows that, when B1 is kept constant, the shaped gradient reduces the nominal amplitude of κ by a factor of 5 (from 0.31 to 0.06) when compared to the linear gradient. The dashed line in this figure shows that the shaped gradient allows B1 to be reduced by a factor of 2.6 (from 170 to 65 Hz) while keeping the nominal amplitude and shape of the κ field approximately the same as it would be with a linear gradient. This would correspond to a factor of 6.76 reduction in SAR.

Similar articles

References

    1. Zaharchuk G, Ledden PJ, Kwong KK, Reese TG, Rosen BR, Wald LL. Multislice perfusion and perfusion territory imaging in humans with separate label and image coils. Magn Reson Med. 1999;41:1093–8. - PubMed
    1. Gach HM, Kam AW, Reid ED, Talagala SL. Quantitative analysis of adiabatic fast passage for steady laminar and turbulent flows. Magn Reson Med. 2002;47:709–19. - PubMed
    1. Norris DG. High field human imaging. J Magn Reson Imaging. 2003;18:519–29. - PubMed
    1. Fernandez-Seara MA, Wang Z, Wang J, Rao HY, Guenther M, Feinberg DA, Detre JA. Continuous arterial spin labeling perfusion measurements using single shot 3D GRASE at 3 T. Magn Reson Med. 2005;54:1241–7. - PubMed
    1. Wang Z, Wang J, Connick TJ, Wetmore GS, Detre JA. Continuous ASL (CASL) perfusion MRI with an array coil and parallel imaging at 3T. Magn Reson Med. 2005;54:732–7. - PubMed

Publication types