Comparative Study
. 2006 Dec 19:7:538.
doi: 10.1186/1471-2105-7-538.

Intensity-based hierarchical Bayes method improves testing for differentially expressed genes in microarray experiments

Affiliations
Comparative Study

Intensity-based hierarchical Bayes method improves testing for differentially expressed genes in microarray experiments

Maureen A Sartor et al. BMC Bioinformatics. .

Abstract

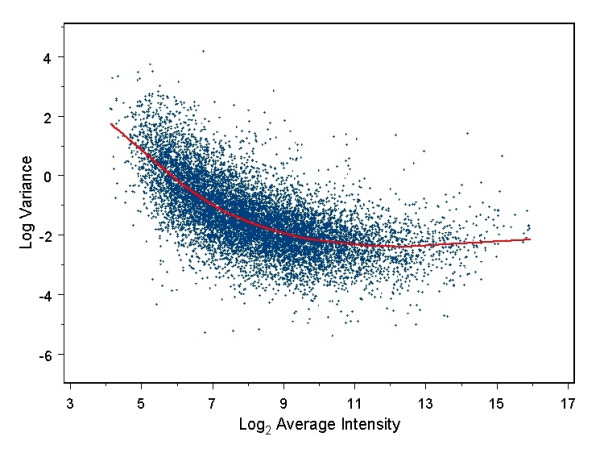
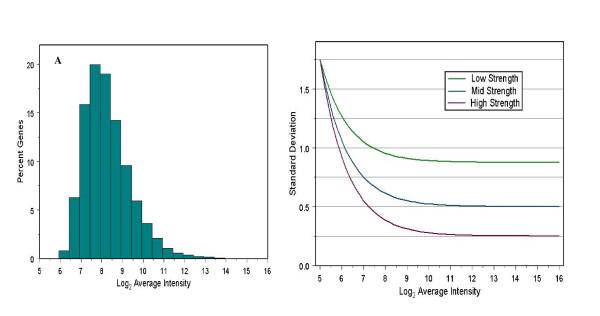
Background: The small sample sizes often used for microarray experiments result in poor estimates of variance if each gene is considered independently. Yet accurately estimating variability of gene expression measurements in microarray experiments is essential for correctly identifying differentially expressed genes. Several recently developed methods for testing differential expression of genes utilize hierarchical Bayesian models to "pool" information from multiple genes. We have developed a statistical testing procedure that further improves upon current methods by incorporating the well-documented relationship between the absolute gene expression level and the variance of gene expression measurements into the general empirical Bayes framework.

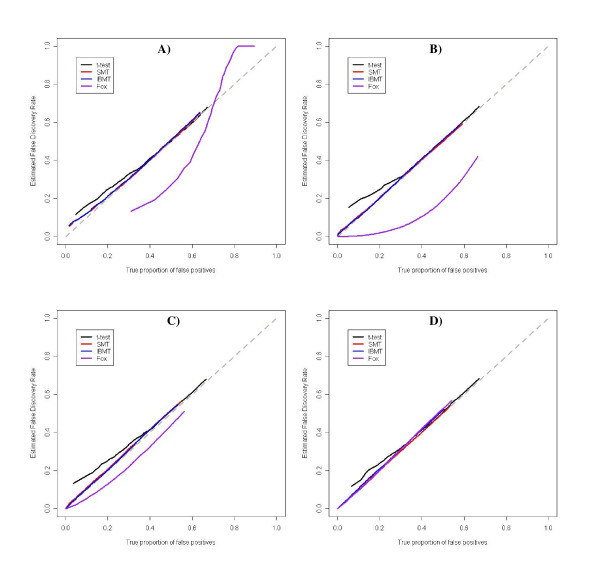
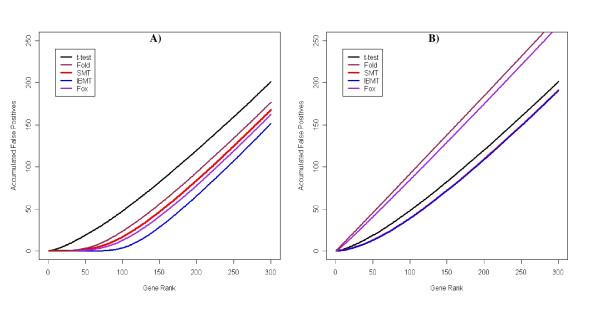
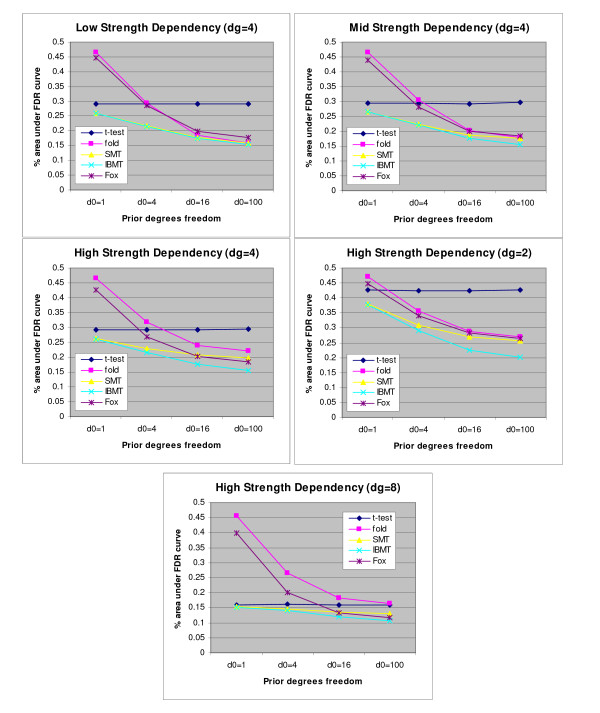
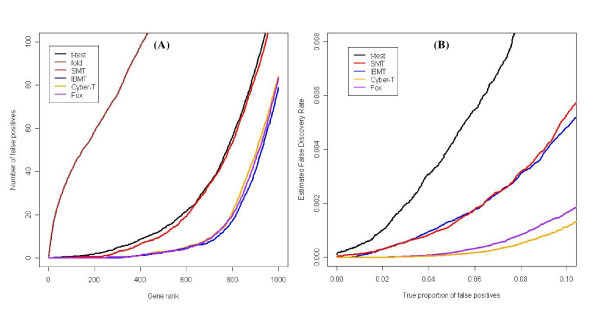
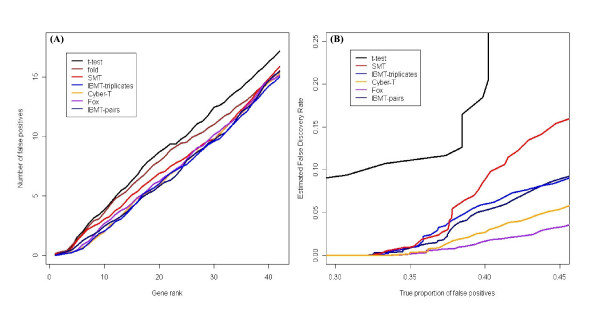
Results: We present a novel Bayesian moderated-T, which we show to perform favorably in simulations, with two real, dual-channel microarray experiments and in two controlled single-channel experiments. In simulations, the new method achieved greater power while correctly estimating the true proportion of false positives, and in the analysis of two publicly-available "spike-in" experiments, the new method performed favorably compared to all tested alternatives. We also applied our method to two experimental datasets and discuss the additional biological insights as revealed by our method in contrast to the others. The R-source code for implementing our algorithm is freely available at http://eh3.uc.edu/ibmt.

Conclusion: We use a Bayesian hierarchical normal model to define a novel Intensity-Based Moderated T-statistic (IBMT). The method is completely data-dependent using empirical Bayes philosophy to estimate hyperparameters, and thus does not require specification of any free parameters. IBMT has the strength of balancing two important factors in the analysis of microarray data: the degree of independence of variances relative to the degree of identity (i.e. t-tests vs. equal variance assumption), and the relationship between variance and signal intensity. When this variance-intensity relationship is weak or does not exist, IBMT reduces to a previously described moderated t-statistic. Furthermore, our method may be directly applied to any array platform and experimental design. Together, these properties show IBMT to be a valuable option in the analysis of virtually any microarray experiment.


Figures

Figure 1
Figure 1
Dependence of gene variance on average log-intensities. Typical example of the form of dependency of log-variance on average log-spot intensity. Red line was determined using local regression. Data were from mouse embryo fibroblast Ahr-/- dataset.
Figure 2
Figure 2
Values used in simulations. (A) Distribution of average log-expression levels. (B) Three strengths of dependency of gene standard deviation on expression intensity used in simulations.
Figure 3
Figure 3
IBMT correctly estimates the proportion of false positives. All tested methods except Fox (t-test, SMT, and IBMT) correctly control for the true false positive rate. Data shown is the average of 100 simulations and the mid-strength dependence of variance on expression level with (A) dg = 4, d0 = 1, (B) dg = 4, d0 = 4, (C) dg = 4, d0 = 16, and (D) dg = 4, d0 = 100.
Figure 4
Figure 4
Example false positive curves. Number of falsely implicated differentially expressed genes with rank ≤ x for the simple t-test, fold change cut-off, SMT, Fox, and IBMT methods. Figure shows the accumulation of false positives by gene rank. Data shown is the average of 100 simulations using (A) the high-strength dependence of variance on expression level and 100 prior degrees of freedom, and (B) the mid-strength dependence and 1 prior degree of freedom.
Figure 5
Figure 5
Areas under false positive curves for all three strengths of dependency of variance on average spot intensity, and for additional simulations. Areas are normalized so that the highest (worst) possible area is 0.50, the lowest (best) being 0.00. (A) Low strength dependency- the fold change method performed poorest for low prior degrees of freedom, while the simple t-test is poorest with high prior degrees of freedom. IBMT performs minimally better than SMT in this case. Fox performs similarly to fold change (B) Medium strength dependency- Similar to above, but with the advantage of IBMT larger for high prior degrees of freedom (C) High strength dependency- IBMT performs better than all other methods, especially for mid to high prior degrees of freedom. (D) 4-slide simulation- Similar to (C), but with overall poorer performance by the t-test, and slightly more advantage by IBMT. (E) 10-slide simulation- Fox now performs significantly better than fold change, but both have very poor performance for low prior degrees of freedom. IBMT still performs best.
Figure 6
Figure 6
Results from the Choe, et al. spike-inexperiment. (A) IBMT results in the fewest false positives overall. The other methods, from best to worst, are Fox, Cyber-T, SMT, t-test, and fold change. (B) Comparison of how accurately each method estimates the true proportion of false positives. The simple t-test performs best in correctly estimating its false positive rate, although all methods underestimate the true number of false positives, as noted in [25]. Fox's method and especially Cyber-T result in the greatest underestimation of false positives.
Figure 7
Figure 7
Results from HG-U133 latin-square spike-in experiment. (A) Methods that account for the dependency of variance on signal intensity (IBMT, Cyber-T, and Fox) accumulate the fewest false positives (B) The simple t-test performs best in estimating the true proportion of false positives, and the others from best to worst, are SMT, IBMT, Cyber-T, and Fox.

References

    1. Allison DB, Cui X, Page GP, Sabripour M. Microarray data analysis: from disarray to consolidation and consensus. Nat Rev Genet. 2006;7:55–65. doi: 10.1038/nrg1749. - DOI - PubMed
    1. Storey JD, Tibshirani R. Statistical significance for genomewide studies. Proc Natl Acad Sci U S A. 2003;100:9440–9445. doi: 10.1073/pnas.1530509100. - DOI - PMC - PubMed
    1. Baldi P, Long AD. A Bayesian framework for the analysis of microarray expression data: regularized t -test and statistical inferences of gene changes. Bioinformatics. 2001;17:509–519. doi: 10.1093/bioinformatics/17.6.509. - DOI - PubMed
    1. Efron B, Tibshirani R, JD S, Tusher V. Empirical bayes analysis of a microarray experiment. J Amer Stat Assoc. 2001;96:1151–1160. doi: 10.1198/016214501753382129. - DOI
    1. Jain N, Thatte J, Braciale T, Ley K, O'Connell M, Lee JK. Local-pooled-error test for identifying differentially expressed genes with a small number of replicated microarrays. Bioinformatics. 2003;19:1945–1951. doi: 10.1093/bioinformatics/btg264. - DOI - PubMed

Publication types

MeSH terms

LinkOut - more resources