

Effects of methylenedianiline on tight junction permeability of biliary epithelial cells in vivo and in vitro
- PMID: 17178199
- PMCID: PMC1866304
- DOI: 10.1016/j.toxlet.2006.11.007
Effects of methylenedianiline on tight junction permeability of biliary epithelial cells in vivo and in vitro
Abstract
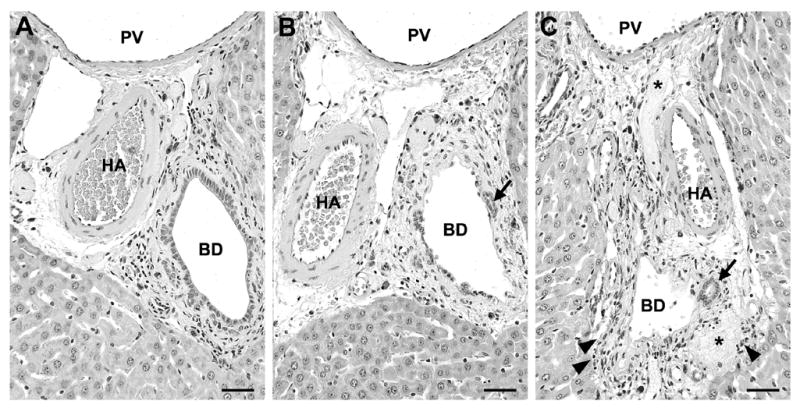
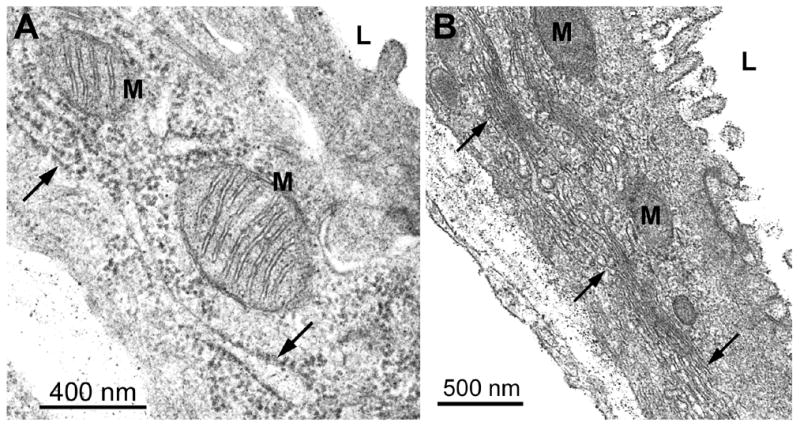
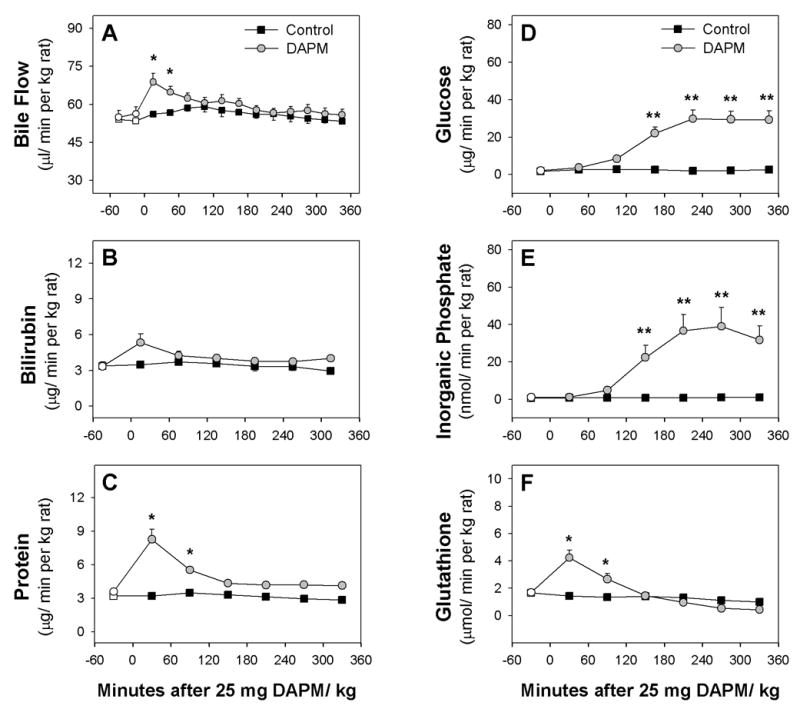
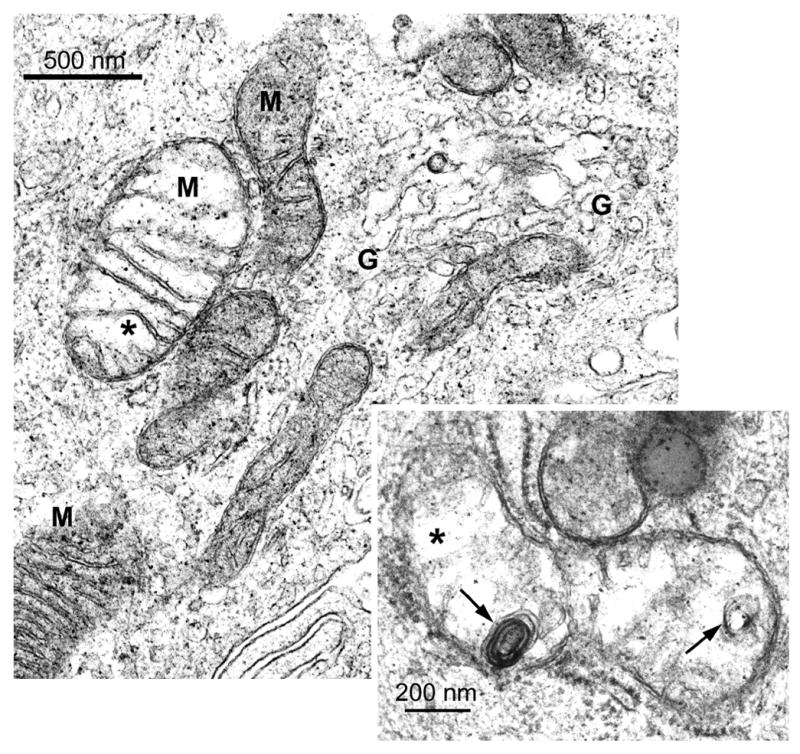
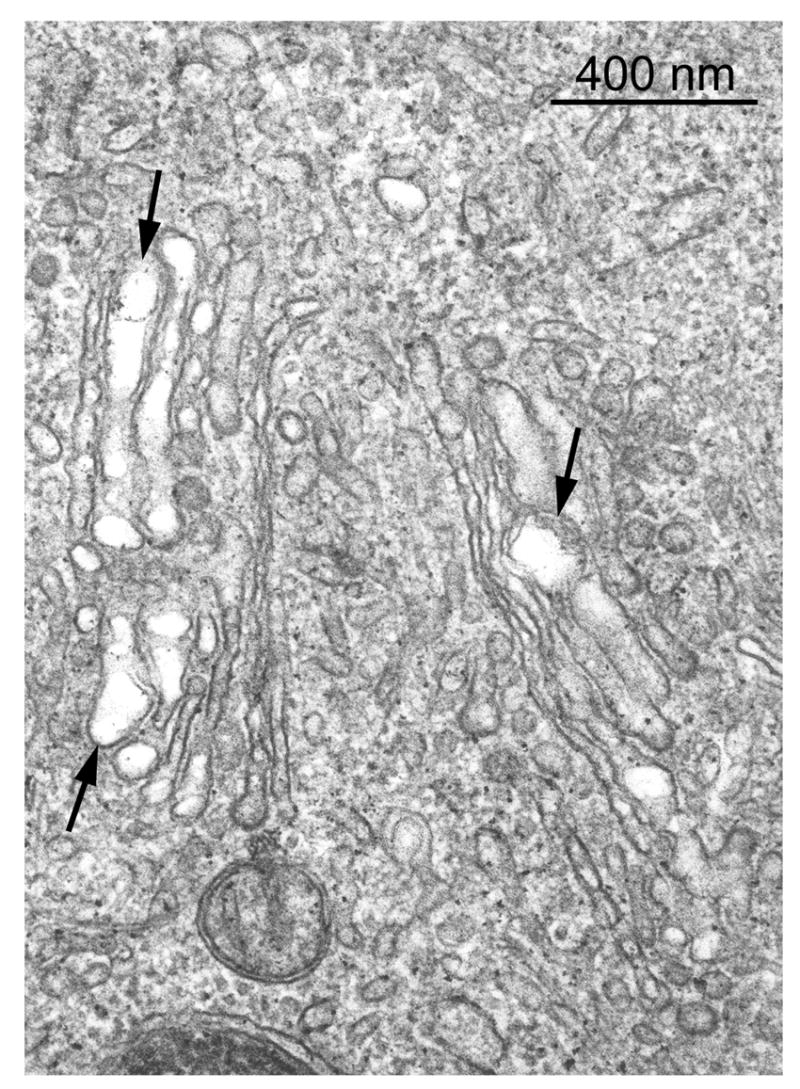
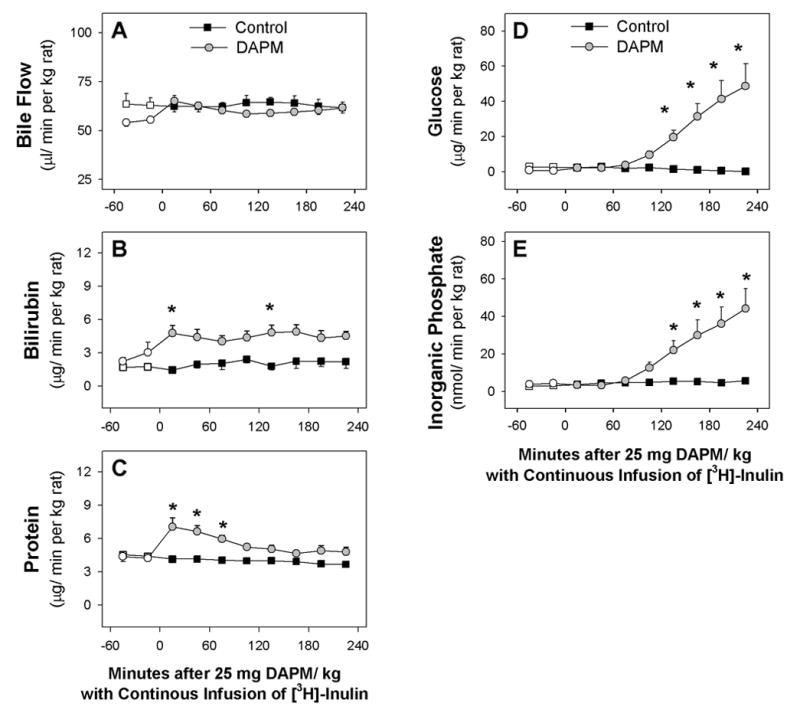
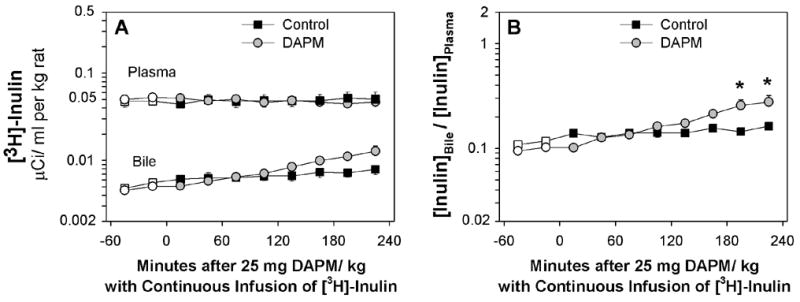
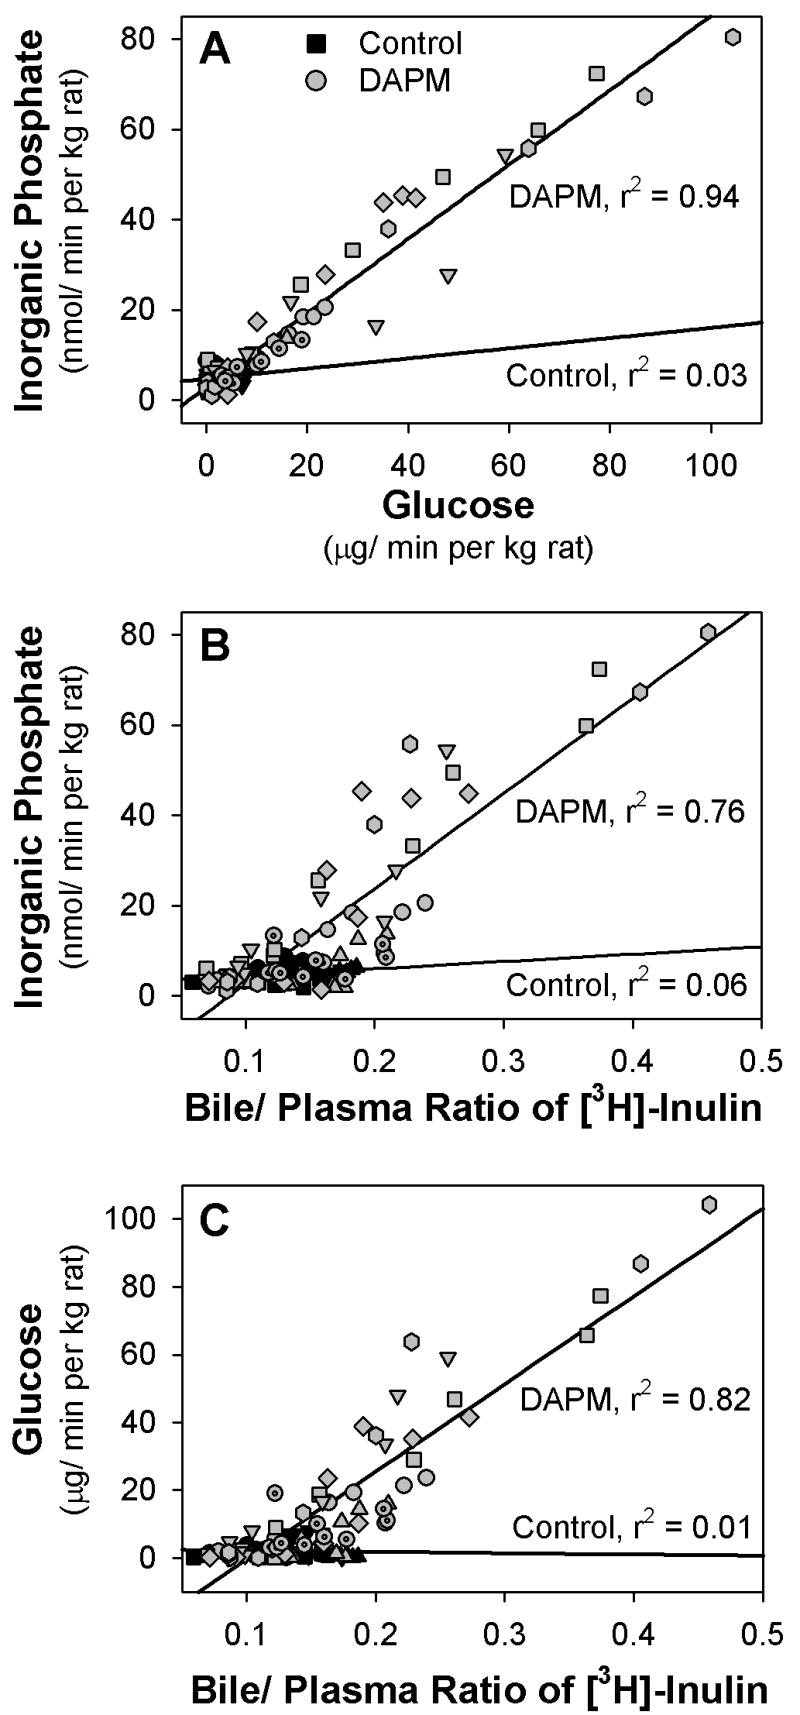
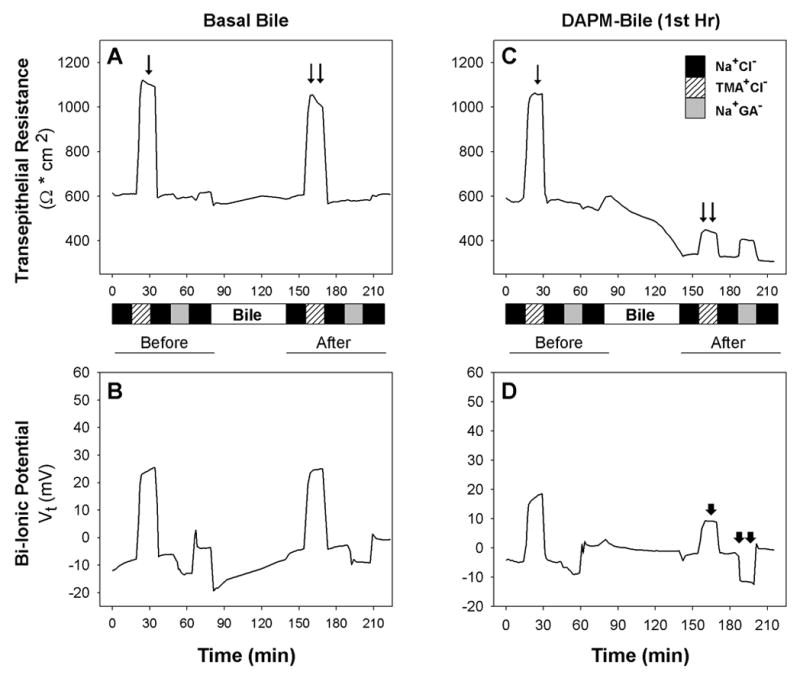
Methylenedianiline (DAPM) is considered a cholangiodestructive toxicant in vivo. Increases in biliary inorganic phosphate (P(i)) and glucose occur prior to biliary epithelial cell (BEC) injury, which could be due to increased paracellular permeability and/or impairment of P(i) and glucose uptake by BEC. To evaluate these possibilities, we induced mild injury [loss of BEC from major bile ducts (6 h), ultrastructural alterations in BEC mitochondria and Golgi cisternae (3 h), and striking increases in biliary P(i) and glucose (3-6 h)] with 25 mg DAPM/kg and then assessed temporal alterations in tight junction (TJ) permeability by measuring bile to plasma (B:P) ratios of [(3)H]-inulin. Parameters maintained by hepatocytes in bile were unchanged (bile flow, bile salts, bilirubin) or only transiently perturbed (protein, glutathione). Minimal elevations in B:P ratios of inulin occurred temporally later (4 h) in DAPM-treated rats than increases in biliary P(i) and glucose. To confirm a direct effect of DAPM on BEC TJs, we measured transepithelial resistance (TER) and bi-ionic potentials of BEC monolayers prior to and after exposure to pooled (4-6) bile samples collected from untreated rats (Basal Bile) or rats treated with 50 mg DAPM/kg (DAPM-Bile). BEC TJs were found to be cation selective. Exposure to DAPM-Bile for 1 h decreased TERs by approximately 35% and decreased charge selectivity of BEC TJs while exposure to Basal Bile had no effects. These observations indicate that DAPM-Bile impairs paracellular permeability of BEC in vitro. Further, our in vivo model suggests that increases in paracellular permeability induced by DAPM are localized to BEC because bile flow and constituents excreted by hepatocytes were unchanged, BEC damage was temporally correlated with increases in biliary P(i) and glucose, and elevations in B:P ratios of inulin were delayed and minimal.
Figures
Similar articles
-
Mitochondrial dysfunction occurs before transport or tight junction deficits in biliary epithelial cells exposed to bile from methylenedianiline-treated rats.Toxicol Sci. 2005 Mar;84(1):129-38. doi: 10.1093/toxsci/kfi061. Epub 2004 Dec 15. Toxicol Sci. 2005. PMID: 15601676
-
A minimally toxic dose of methylene dianiline injures biliary epithelial cells in rats.Toxicol Appl Pharmacol. 1998 Jun;150(2):414-26. doi: 10.1006/taap.1998.8382. Toxicol Appl Pharmacol. 1998. PMID: 9653073
-
Glutathione depletion exacerbates methylenedianiline toxicity to biliary epithelial cells and hepatocytes in rats.Toxicol Sci. 2003 Aug;74(2):447-56. doi: 10.1093/toxsci/kfg125. Epub 2003 May 28. Toxicol Sci. 2003. PMID: 12773769
-
Biliary secretion of endotoxin and pathogenesis of primary biliary cirrhosis.Yale J Biol Med. 1997 Jul-Aug;70(4):403-8. Yale J Biol Med. 1997. PMID: 9626760 Free PMC article. Review.
-
Drug-induced bile duct injury.Biochim Biophys Acta Mol Basis Dis. 2018 Apr;1864(4 Pt B):1498-1506. doi: 10.1016/j.bbadis.2017.08.033. Epub 2017 Sep 4. Biochim Biophys Acta Mol Basis Dis. 2018. PMID: 28882625 Review.
Cited by
-
Analysis of Gene Expression in 4,4'-Methylenedianiline-induced Acute Hepatotoxicity.Toxicol Res. 2009 Jun;25(2):85-92. doi: 10.5487/TR.2009.25.2.085. Epub 2009 Jun 1. Toxicol Res. 2009. PMID: 32038824 Free PMC article.
-
Industrial, Biocide, and Cosmetic Chemical Inducers of Cholestasis.Chem Res Toxicol. 2019 Jul 15;32(7):1327-1334. doi: 10.1021/acs.chemrestox.9b00148. Epub 2019 Jun 18. Chem Res Toxicol. 2019. PMID: 31243985 Free PMC article.
-
Kynu inhibition mitigates bile duct ischemic injury by rewiring tryptophan metabolism to restore tight junction integrity.Mol Med. 2025 Aug 19;31(1):279. doi: 10.1186/s10020-025-01310-6. Mol Med. 2025. PMID: 40830424 Free PMC article.
References
-
- Ballatori N, Truong AT. Glutathione as a primary osmotic driving force in hepatic bile formation. Am J Physiol. 1992;263:G617–G624. - PubMed
-
- Barry PH. Ionic permeation mechanisms in epithelia: biionic potentials, dilution potentials, conductances and streaming potentials. Methods Enzymol. 1989;171:678–715. - PubMed
-
- Barry PH, Diamond JM, Wright EM. The mechanism of cation permeation in rabbit gallbladder: Dilution potentials and biionic potentials. J Membr Biol. 1971;4:358–394. - PubMed
-
- Bastien PG. Occupational hepatitis caused by methylenedianiline. Med J Aust. 1984;141:533–535. - PubMed
Publication types
MeSH terms
Substances
Grants and funding
LinkOut - more resources
Full Text Sources
Research Materials
Miscellaneous
