. 2007;35(3):e15.
doi: 10.1093/nar/gkl1030. Epub 2006 Dec 18.

High resolution array-CGH analysis of single cells

Affiliations

High resolution array-CGH analysis of single cells

Heike Fiegler et al. Nucleic Acids Res. 2007.

Abstract

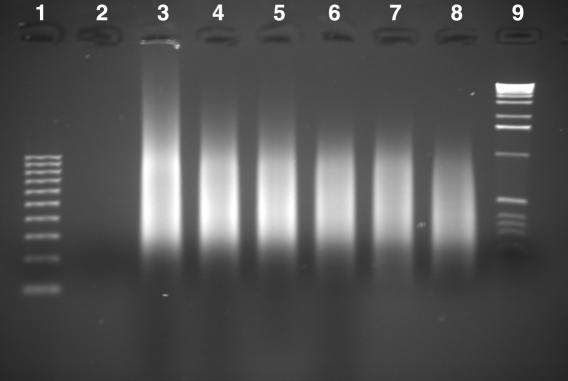
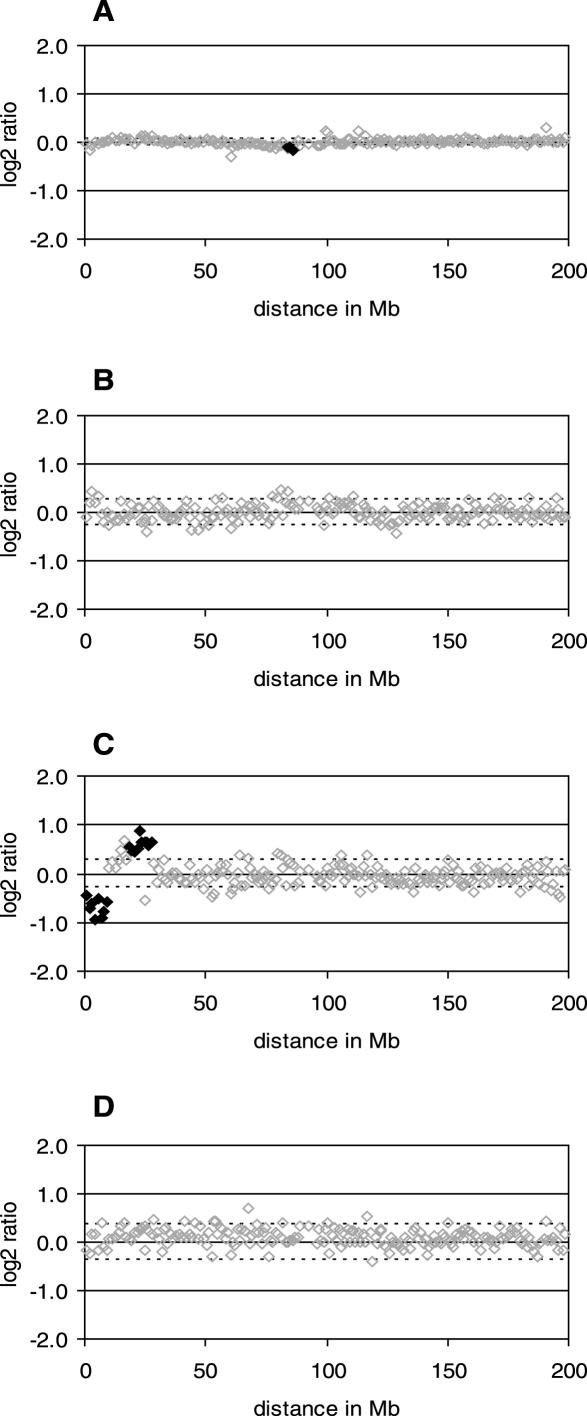
Heterogeneity in the genome copy number of tissues is of particular importance in solid tumor biology. Furthermore, many clinical applications such as pre-implantation and non-invasive prenatal diagnosis would benefit from the ability to characterize individual single cells. As the amount of DNA from single cells is so small, several PCR protocols have been developed in an attempt to achieve unbiased amplification. Many of these approaches are suitable for subsequent cytogenetic analyses using conventional methodologies such as comparative genomic hybridization (CGH) to metaphase spreads. However, attempts to harness array-CGH for single-cell analysis to provide improved resolution have been disappointing. Here we describe a strategy that combines single-cell amplification using GenomePlex library technology (GenomePlex) Single Cell Whole Genome Amplification Kit, Sigma-Aldrich, UK) and detailed analysis of genomic copy number changes by high-resolution array-CGH. We show that single copy changes as small as 8.3 Mb in single cells are detected reliably with single cells derived from various tumor cell lines as well as patients presenting with trisomy 21 and Prader-Willi syndrome. Our results demonstrate the potential of this technology for studies of tumor biology and for clinical diagnostics.


Figures

Figure 1
Figure 1
Gel image of amplified single cells. lane 1: 100 kb size marker; lane 2: negative control; lane 3: positive control provided in the Sigma kit; lane 4: single cell—normal female; lane 5: single cell—trisomy 21; lane 6: single cell—HCT116; lane 7: single cell—Prader–Willi syndrome; lane 8: single cell—769P; lane 9: lambda-HindIII size marker.
Figure 2
Figure 2
Array-CGH analysis of a female renal cell carcinoma cell line (769P) (A). Chromosome 1 profile using non-amplified genomic DNA versus non-amplified genomic DNA of a normal male individual (threshold ± 0.11). (B). Chromosome 1 profile, using amplified single-cell DNA, versus non-amplified genomic DNA of a normal male individual (threshold ±0.37). Closed diamonds: data points called above or below a threshold of 1.5× SDe indicating areas of single copy gain or loss detected across the chromosome. Open diamonds: non-called data points. Thresholds are indicated by black dashed lines.
Figure 3
Figure 3
Array-CGH analysis of a male colorectal cell line (HCT116). Chromosome 3 profiles of non-amplified control DNA (A) (threshold ± 0.081) and three independently isolated and treated single cells [thresholds ± 0.266 (Cell 1; B), ±0.291 (Cell 2; C) and ±0.381 (Cell 3; D)]. Closed diamonds: data points called above or below a threshold of 1.5× SDe indicating areas of single copy gain or loss detected across the chromosome. Open diamonds: non-called data points. Thresholds are indicated by black dashed lines.
Figure 4
Figure 4
Array-CGH analysis of a female patient presenting with Down syndrome. Chromosome 21 profiles of three independently isolated and treated cells using the full tiling path set with thresholds of ±0.305 (Cell 1; A), ±0.35 (Cell 2; B) and ±0.308 (Cell 3; C) and the simulated 1 Mb data set with thresholds of ±0.52 (Cell 1; D), ±0.57 (Cell 2; E) and ±0.53 (Cell 3; F). Closed diamonds: data points called above or below a threshold of 1.5× SDe indicating areas of single copy gain or loss detected across the chromosome. Open diamonds: non-called data points. Thresholds are indicated by black dashed lines.
Figure 5
Figure 5
Log2 ratio average across autosomes in three individually treated cells derived from a patient presenting with Down syndrome. Grey bars: chromosome averages within a threshold of ±3× SD; black bars: chromosome averages above/below a threshold of ±3× SD. Thresholds are indicated by black dashed lines and have been calculated as 0.24 (Cell 1; A), 0.23 (Cell 2; B) and 0.25 (Cell 3; C)
Figure 6
Figure 6
Array-CGH analysis of a male patient presenting with Prader Willi syndrome. Chromosome 15 profiles of non-amplified control DNA and three independently isolated and treated single cells analyzed using the full tiling path set and with thresholds of ±0.05 [non-amplified DNA (A)], ±0.21 (Cell 1; B), ±0.25 (Cell 2; C) and ±0.21 (Cell 3; D) and the simulated 1 Mb data set with thresholds of ±0.08 [non-amplified DNA (E)], ±0.37 (Cell 1; F), ±0.44 (Cell 2; G) and ±0.38 (Cell 3; H). Closed diamonds: data points called above or below a threshold of 1.5× SDe indicating areas of single copy gain or loss detected across the chromosome. Open diamonds: non-called data points. Thresholds are indicated by black dashed lines.
Figure 7
Figure 7
Array-CGH analysis of a female renal cell carcinoma cell line (769P). Chromosome 9 profile of non-amplified control DNA and three independently isolated and treated single cells with thresholds of ±0.11 [non-amplified DNA (A)], ±0.37 (Cell 1; B), ±0.43 (Cell 2; C) and ±0.36 (Cell 3; D). Closed diamonds: data points called above or below a threshold of 1.5× SDe indicating areas of single copy gain or loss detected across the chromosome. Open diamonds: non-called data points. Thresholds are indicated by black dashed lines.

References

    1. Telenius H., Carter N.P., Bebb C.E., Nordenskjold M., Ponder B.A., Tunnacliffe A. Degenerate oligonucleotide-primed PCR: general amplification of target DNA by a single degenerate primer. Genomics. 1992;13:718–725. - PubMed
    1. Speicher M.R., du Manoir S., Schrock E., Holtgreve-Grez H., Schoell B., Lengauer C., Cremer T., Ried T. Molecular cytogenetic analysis of formalin-fixed, paraffin-embedded solid tumors by comparative genomic hybridization after universal DNA-amplification. Hum. Mol. Genet. 1993;2:1907–1914. - PubMed
    1. Speicher M.R., Howe C., Crotty P., du Manoir S., Costa J., Ward D.C. Comparative genomic hybridization detects novel deletions and amplifications in head and neck squamous cell carcinomas. Cancer Res. 1995;55:1010–1013. - PubMed
    1. Speicher M.R., Jauch A., Walt H., du Manoir S., Ried T., Jochum W., Sulser T., Cremer T. Correlation of microscopic phenotype with genotype in a formalin-fixed, paraffin-embedded testicular germ cell tumor with universal DNA amplification, comparative genomic hybridization, and interphase cytogenetics. Am. J. Pathol. 1995;146:1332–1340. - PMC - PubMed
    1. Wiltshire R.N., Duray P., Bittner M.L., Visakorpi T., Meltzer P.S., Tuthill R.J., Liotta L.A., Trent J.M. Direct visualization of the clonal progression of primary cutaneous melanoma: application of tissue microdissection and comparative genomic hybridization. Cancer Res. 1995;55:3954–3957. - PubMed

Publication types