

Identifying quantitative trait locus by genetic background interactions in association studies
- PMID: 17179077
- PMCID: PMC1893042
- DOI: 10.1534/genetics.106.062992
Identifying quantitative trait locus by genetic background interactions in association studies
Abstract
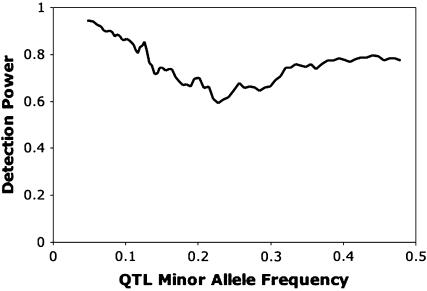
Association studies are designed to identify main effects of alleles across a potentially wide range of genetic backgrounds. To control for spurious associations, effects of the genetic background itself are often incorporated into the linear model, either in the form of subpopulation effects in the case of structure or in the form of genetic relationship matrices in the case of complex pedigrees. In this context epistatic interactions between loci can be captured as an interaction effect between the associated locus and the genetic background. In this study I developed genetic and statistical models to tie the locus by genetic background interaction idea back to more standard concepts of epistasis when genetic background is modeled using an additive relationship matrix. I also simulated epistatic interactions in four-generation randomly mating pedigrees and evaluated the ability of the statistical models to identify when a biallelic associated locus was epistatic to other loci. Under additive-by-additive epistasis, when interaction effects of the associated locus were quite large (explaining 20% of the phenotypic variance), epistasis was detected in 79% of pedigrees containing 320 individuals. The epistatic model also predicted the genotypic value of progeny better than a standard additive model in 78% of simulations. When interaction effects were smaller (although still fairly large, explaining 5% of the phenotypic variance), epistasis was detected in only 9% of pedigrees containing 320 individuals and the epistatic and additive models were equally effective at predicting the genotypic values of progeny. Epistasis was detected with the same power whether the overall epistatic effect was the result of a single pairwise interaction or the sum of nine pairwise interactions, each generating one ninth of the epistatic variance. The power to detect epistasis was highest (94%) at low QTL minor allele frequency, fell to a minimum (60%) at minor allele frequency of about 0.2, and then plateaued at about 80% as alleles reached intermediate frequencies. The power to detect epistasis declined when the linkage disequilibrium between the DNA marker and the functional polymorphism was not complete.
Figures
References
-
- Arbelbide, M., and R. Bernardo, 2006. Mixed-model QTL mapping for kernel hardness and dough strength in bread wheat. Theor. Appl. Genet. 112: 885–890. - PubMed
-
- Beer, S. C., W. Siripoonwiwat, L. S. O'Donoughue, E. Sousza, D. Matthews et al., 1997. Associations between molecular markers and quantitative traits in an oat germplasm pool: Can we infer linkages? J. Agric. Genomics 3 (http://wheat.pw.usda.gov/jag).
-
- Blanc, G., A. Charcosset, B. Mangin, A. Gallais and L. Moreau, 2006. Connected populations for detecting quantitative trait loci and testing for epistasis: an application in maize. Theor. Appl. Genet. 113: 206–224. - PubMed
-
- Carlborg, O., L. Jacobsson, P. Ahgren, P. Siegel and L. Andersson, 2006. Epistasis and the release of genetic variation during long-term selection. Nat. Genet. 38: 418–420. - PubMed
Publication types
MeSH terms
LinkOut - more resources
Full Text Sources
Miscellaneous
