Comparative Study
. 2007 Mar;175(3):1441-50.
doi: 10.1534/genetics.106.064972. Epub 2006 Dec 18.

Global eQTL mapping reveals the complex genetic architecture of transcript-level variation in Arabidopsis

Affiliations
Comparative Study

Global eQTL mapping reveals the complex genetic architecture of transcript-level variation in Arabidopsis

Marilyn A L West et al. Genetics. 2007 Mar.

Abstract

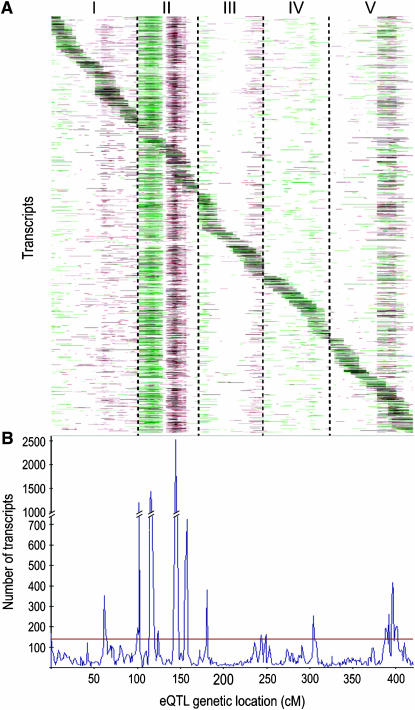
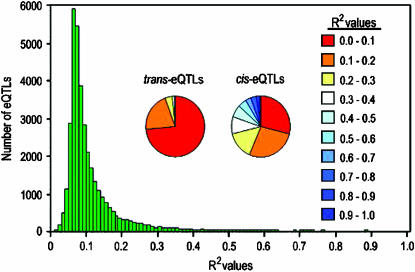
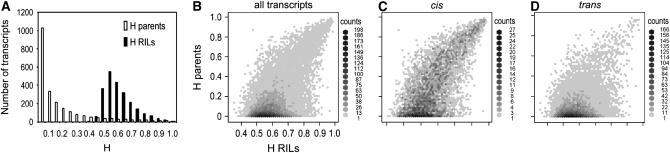
The genetic architecture of transcript-level variation is largely unknown. The genetic determinants of transcript-level variation were characterized in a recombinant inbred line (RIL) population (n = 211) of Arabidopsis thaliana using whole-genome microarray analysis and expression quantitative trait loci (eQTL) mapping of transcript levels as expression traits (e-traits). Genetic control of transcription was highly complex: one-third of the quantitatively controlled transcripts/e-traits were regulated by cis-eQTL, and many trans-eQTL mapped to hotspots that regulated hundreds to thousands of e-traits. Several thousand eQTL of large phenotypic effect were detected, but almost all (93%) of the 36,871 eQTL were associated with small phenotypic effects (R(2) < 0.3). Many transcripts/e-traits were controlled by multiple eQTL with opposite allelic effects and exhibited higher heritability in the RILs than their parents, suggesting nonadditive genetic variation. To our knowledge, this is the first large-scale global eQTL study in a relatively large plant mapping population. It reveals that the genetic control of transcript level is highly variable and multifaceted and that this complexity may be a general characteristic of eukaryotes.


Figures

F<sc>igure</sc> 1.—
Figure 1.—
Genomic architecture of eQTL across five Arabidopsis chromosomes. (A) Heat map of LRT statistics obtained by CIM eQTL analysis for 22,591 nuclear-encoded transcripts (y-axis) plotted against 464 markers (x-axis) across five chromosomes. Colors indicate chromosomal regions where LRT statistics were significantly greater than the global permutation threshold (GPT > 12.0583) at P < 0.05. Red indicates a positive effect of the presence of the Sha allele, and green indicates a positive effect of the Bay-0 allele. Vertical dotted lines separate the five chromosomes (I–V). (B) Numbers of transcripts/e-traits for which eQTL are detected. The number of transcripts is indicated on the y-axis, plotted against the genetic location of the eQTL in centimorgans on the x-axis. The permuted threshold (P = 0.05) for detection of a significant trans-eQTL hotspot is 133 transcripts, indicated by the red horizontal line.
F<sc>igure</sc> 2.—
Figure 2.—
Distribution of the percentage of phenotypic effect (R2) for all eQTL. A histogram of the distribution of R2 values for all 36,871 eQTL is shown separated into 0.01 bins; the maximum R2 was 0.97. The two pie graphs illustrate the R2 distributions for eQTL that are cis (5127 total cis-eQTL) or trans (31,777 total trans-eQTL) to the gene's physical position. The color scale to the right indicates the R2 bins for the pie graphs.
F<sc>igure</sc> 3.—
Figure 3.—
Transcript-level/e-trait heritabilities in RILs vs. parents. (A) Histograms of estimated broad-sense heritability (H) values in RILs and parents (Bay-0 and Sha). Solid bars show the histogram of heritability values for all 22,746 transcripts/e-traits as estimated with the RIL microarray data. Open bars show the histogram of H for all 22,746 transcripts/e-traits as estimated with the parental (Bay-0 and Sha) microarray data. (B–D) Relationship between estimated transcript/e-trait H in the RILs and in the parents. H-values for all 22,746 transcripts are plotted as a hexbin graph for both the RIL (x-axis) and the parental (y-axis) H estimates. The shading scale to the right of each figure indicates data-point density per bin. The x- and y- axes for B–D are identical. (B) All transcripts. (C) Transcripts for which a cis-eQTL was mapped. (D) Transcripts that mapped to only trans-eQTL (no cis).

Similar articles

Cited by

References

    1. Basten, C. J., B. S. Weir and Z.-B. Zeng, 1999. QTL Cartographer, Version 1.13. Department of Statistics, North Carolina State University, Raleigh, NC.
    1. Beavis, W. D., 1998. QTL analyses: power, precision, and accuracy, pp. 145–162 in Molecular Dissection of Complex Traits, edited by A. H. Paterson. CRC Press, Cleveland/Boca Raton, FL.
    1. Berardini, T., S. Mundodi, R. Reiser, E. Huala, M. Garcia-Hernandez et al., 2004. Functional annotation of the Arabidopsis genome using controlled vocabularies. Plant Physiol. 135: 1–11. - PMC - PubMed
    1. Bogdan, M., and R. W. Doerge, 2005. Biased estimators of quantitative trait locus heritability and location in interval mapping. Heredity 95: 476–484. - PubMed
    1. Bolstad, B. M., R. A. Irizarry, M. Astrand and T. P. Speed, 2003. A comparison of normalization methods for high density oligonucleotide array data based on variance and bias. Bioinformatics 19: 185–193. - PubMed

Publication types