. 2007 Jun;17(6):877-85.
doi: 10.1101/gr.5533506. Epub 2006 Dec 19.

FAIRE (Formaldehyde-Assisted Isolation of Regulatory Elements) isolates active regulatory elements from human chromatin

Affiliations

FAIRE (Formaldehyde-Assisted Isolation of Regulatory Elements) isolates active regulatory elements from human chromatin

Paul G Giresi et al. Genome Res. 2007 Jun.

Abstract

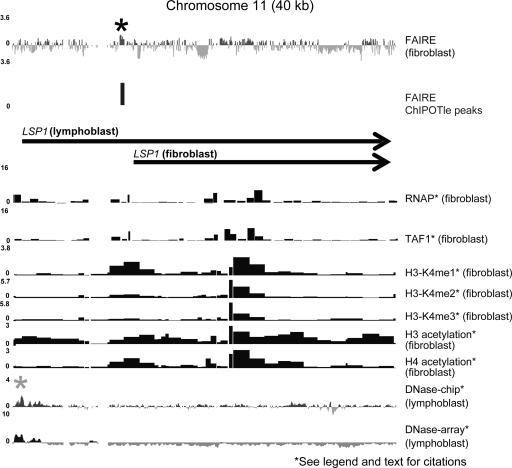
DNA segments that actively regulate transcription in vivo are typically characterized by eviction of nucleosomes from chromatin and are experimentally identified by their hypersensitivity to nucleases. Here we demonstrate a simple procedure for the isolation of nucleosome-depleted DNA from human chromatin, termed FAIRE (Formaldehyde-Assisted Isolation of Regulatory Elements). To perform FAIRE, chromatin is crosslinked with formaldehyde in vivo, sheared by sonication, and phenol-chloroform extracted. The DNA recovered in the aqueous phase is fluorescently labeled and hybridized to a DNA microarray. FAIRE performed in human cells strongly enriches DNA coincident with the location of DNaseI hypersensitive sites, transcriptional start sites, and active promoters. Evidence for cell-type-specific patterns of FAIRE enrichment is also presented. FAIRE has utility as a positive selection for genomic regions associated with regulatory activity, including regions traditionally detected by nuclease hypersensitivity assays.


Figures

Figure 1.
Figure 1.
FAIRE in human cells is illustrated on the left, while preparation of the reference is illustrated on the right. For FAIRE, formaldehyde is added directly to cultured cells. The crosslinked chromatin is then sheared by sonication and phenol-chloroform extracted. Crosslinking between histones and DNA (or between one histone and another) is likely to dominate the chromatin crosslinking profile (Brutlag et al. 1969; Solomon and Varshavsky 1985; Polach and Widom 1995). Covalently linked protein–DNA complexes are sequestered to the organic phase, leaving only protein-free DNA fragments in the aqueous phase. For the hybridization reference, the same procedure is performed on a portion of the cells that had not been fixed with formaldehyde, a procedure identical to a traditional phenol-chloroform extraction. DNA resulting from each procedure is then labeled with a fluorescent dye, mixed, and comparatively hybridized to DNA microarrays. In this case, we used high-density oligonucleotide arrays that tile across the ENCODE regions of the human genome (30 Mb).
Figure 2.
Figure 2.
FAIRE enrichment of regulatory DNA across 80 kb of human chromosome 19. FAIRE data were loaded into the UCSC Genome Browser along with data sets generated by other ENCODE Consortium members (labeled on the right). The top track represents the average log2 ratios for the FAIRE data from four independent cultures (biological replicates), each of which were crosslinked separately (for 1, 2, 4, and 7 min). The second track shows FAIRE peaks (cutoff = P < 10−25) as determined by ChIPOTle (Buck et al. 2005). The GENCODE annotations represent experimentally verified transcribed segments (Ashurst et al. 2005; Harrow et al. 2006). “Promoter activity” represents the average activity of a reporter construct driven by each of the indicated regions and measured across 16 cell lines, where light gray bars indicate high activity and black bars no activity (Trinklein et al. 2003; Cooper et al. 2006). ChIP–chip data for RNAP and TAF1 from lung fibroblast cells (IMR90) are displayed as the –log10 of the P-value for each probe, scaled to 0–16 (Kim et al. 2005a, b). ChIP–chip data for histone H3 and H4 acetylation and H3K4 mono-, di-, and trimethylation in embryonic lung fibroblast cells (HFL-1) are shown as the ratio of ChIP signal over background (Koch et al. 2007). Finally, data on DNaseI hypersensitivity are shown for two different techniques, DNase-chip and DNase-array. Both techniques isolate DNA fragments flanking DNaseI cleavage sites and map them back to the genome using microarrays (Crawford et al. 2006; Sabo et al. 2006). The data shown for DNase-chip are the average log2 ratio for nine replicates (3 biological at 3 different enzyme concentrations), whereas the DNase-array data are the log2 ratios scaled so that a log2 ratio of 0 represents the 99% confidence bound on the experimental noise. The region shown corresponds to chromosome 19 coordinates 59,330,000 to 59,409,000.
Figure 3.
Figure 3.
FAIRE isolates DNA at the TSSs of genes. (A) Probes that mapped to predicted promoters were divided into quartiles based on the level of activity for each promoter, which was measured by using it to drive a reporter construct (Trinklein et al. 2003; Cooper et al. 2006). The reported activity represents an average from the 16 different cell types assayed. Boxes represent the 25th to the 75th percentile of the FAIRE data (interquartile range, IQR), the black line in the middle of the box is the median, and the dotted lines extend out 1.5 times the IQR. Probes within the regions of highest regulatory activity (fourth quartile, right side), represent the most active promoters and correspond to regions most efficiently isolated by FAIRE (**P < 10−100). (B) Probes from the high-density oligonucleotide tiling array were mapped relative to GENCODE annotated TSSs (Ashurst et al. 2005; Harrow et al. 2006). A sliding window (50 bp, 1-bp steps) was then used to calculate the average FAIRE enrichment from 1.5 kb upstream to 1.5 kb downstream of the TSS (solid line). For comparison, the same analysis was performed using the DNase-chip data set (broken line); DNase-chip samples were hybridized to the same design of high-density oligonucleotide tiling array as was used for FAIRE. (C) A representation of the relationship between FAIRE peaks and other annotated features. Each row corresponds to one of the 571 FAIRE peaks that overlap with at least one of the following: a TSS (Ashurst et al. 2005; Harrow et al. 2006); union of DHS (Crawford et al. 2006; Sabo et al. 2006); 75th percentile of promoter activity (Trinklein et al. 2003; Cooper et al. 2006); RNAP ChIP–chip; or TAF1 ChIP–chip (Kim et al. 2005a, b). A black bar represents overlap with the FAIRE signal, whereas white represents no overlap (“overlap” defined in Table 1 legend). Not shown are the 437 FAIRE peaks that do not overlap with any of these marks. Data were clustered for display (Eisen et al. 1998). (D) qPCR validation of the microarray data was performed over three 8-kb regions. The height of the bars from the qPCR analysis represents the enrichment of the FAIRE samples relative to the uncrosslinked reference; the FAIRE data and peaks are the same as described in Figure 2. A representative region corresponding to chromosome 21 coordinates 32,813,792–32,820,968 is shown. Note that this region contains no annotated genes and that these were “orphan” FAIRE peaks, unassigned to any other active chromatin mark.
Figure 4.
Figure 4.
Cell-type specific differences identified by FAIRE. (A) A scatterplot of the log2 values for individual 50-mer probes from the DNase-chip (Crawford et al. 2006) and FAIRE data sets that mapped between 0 and 500 bp upstream of a GENCODE TSS (Harrow et al. 2006) are plotted. The black oval indicates probes that had high enrichment values in both data sets, whereas the gray ovals indicate probes with enrichment values that were high in only one of the data sets. (B) Same as A, but probes that mapped from 500 to 2000 bp upstream of a GENCODE TSS are plotted. (C) The fibroblast growth factor 1 (FGF1) gene, which has several annotated TSSs, exhibits extensive FAIRE signal (performed in fibroblast cells) but no detectable DNaseI signal (performed in lymphoblastoid cells). The asterisk indicates the presence of RNAP and TAF1 ChIP signal over this region in lung fibroblast (IMR90) cells (Kim et al. 2005a, b). The units of data for each track are described in Figure 2. The region shown corresponds to chromosome 5 coordinates 141,950,000 to 142,060,000.
Figure 5.
Figure 5.
Tissue-specific accessibility of the LSP1 promoter at alternative TSSs FAIRE from fibroblasts and the DNaseI hypersensitivity data (Crawford et al. 2006; Sabo et al. 2006) from lymphoblastoid cells correspond to alternative, tissue-specific promoter usage at the LSP1 gene. On the top track, an asterisk marks the peak in the raw FAIRE data that corresponds to the TSS shown to be active in fibroblast cells. Data corresponding to RNAP, TAF1, and the histone modifications from adult and embryonic lung fibroblast cells are shown in the tracks below (Kim et al. 2005a, ; Koch et al. 2007). These tracks are also consistent with the utilization of this TSS in fibroblast cells. The bottom two tracks show DNaseI hypersensitivity results from lymphoblast cells, with a peak that corresponds only to the TSS for the lymphoblast-specific transcript (gray asterisk). An unannotated TSS about 10 kb downstream of the second TSS is suggested by the FAIRE signal (upper track, just below the 10−25 cutoff for peak detection) and the strong ChIP–chip signals. The units of data for each track are described in Figure 2. The region shown corresponds to chromosome 11 coordinates 1,830,000 to 1,870,000.

References

    1. Alberts B., Johnson A., Lewis J., Raff M., Roberts K., Walter P., Johnson A., Lewis J., Raff M., Roberts K., Walter P., Lewis J., Raff M., Roberts K., Walter P., Raff M., Roberts K., Walter P., Roberts K., Walter P., Walter P. Molecular Biology of the Cell. Garland Science; New York: 2002.
    1. Ashurst J.L., Chen C.K., Gilbert J.G., Jekosch K., Keenan S., Meidl P., Searle S.M., Stalker J., Storey R., Trevanion S., Chen C.K., Gilbert J.G., Jekosch K., Keenan S., Meidl P., Searle S.M., Stalker J., Storey R., Trevanion S., Gilbert J.G., Jekosch K., Keenan S., Meidl P., Searle S.M., Stalker J., Storey R., Trevanion S., Jekosch K., Keenan S., Meidl P., Searle S.M., Stalker J., Storey R., Trevanion S., Keenan S., Meidl P., Searle S.M., Stalker J., Storey R., Trevanion S., Meidl P., Searle S.M., Stalker J., Storey R., Trevanion S., Searle S.M., Stalker J., Storey R., Trevanion S., Stalker J., Storey R., Trevanion S., Storey R., Trevanion S., Trevanion S., et al. The Vertebrate Genome Annotation (Vega) database. Nucleic Acids Res. 2005;33:D459–D465. - PMC - PubMed
    1. Benjamini Y., Hochberg Y., Hochberg Y. Controlling the false discovery rate: A practical and powerful approach to multiple testing. J. R. Stat. Soc. Ser. B Methodol. 1995;57:289–300.
    1. Bernstein B.E., Liu C.L., Humphrey E.L., Perlstein E.O., Schreiber S.L., Liu C.L., Humphrey E.L., Perlstein E.O., Schreiber S.L., Humphrey E.L., Perlstein E.O., Schreiber S.L., Perlstein E.O., Schreiber S.L., Schreiber S.L. Global nucleosome occupancy in yeast. Genome Biol. 2004;5:R62. - PMC - PubMed
    1. Boeger H., Griesenbeck J., Strattan J.S., Kornberg R.D., Griesenbeck J., Strattan J.S., Kornberg R.D., Strattan J.S., Kornberg R.D., Kornberg R.D. Nucleosomes unfold completely at a transcriptionally active promoter. Mol. Cell. 2003;11:1587–1598. - PubMed

Publication types