

A high throughput drug screen based on fluorescence resonance energy transfer (FRET) for anticancer activity of compounds from herbal medicine
- PMID: 17179946
- PMCID: PMC2013898
- DOI: 10.1038/sj.bjp.0706988
A high throughput drug screen based on fluorescence resonance energy transfer (FRET) for anticancer activity of compounds from herbal medicine
Abstract
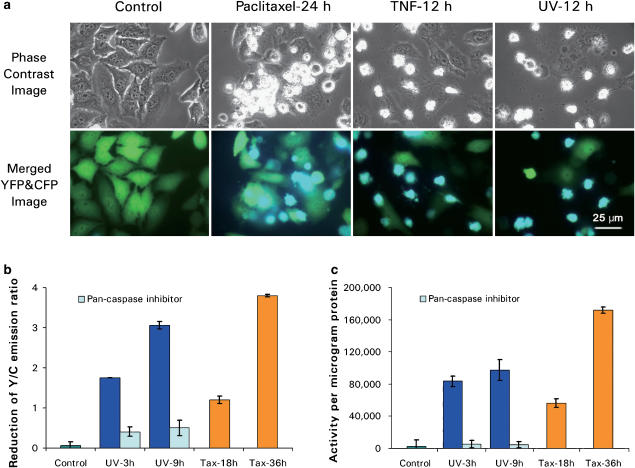
Background and purpose: We report the development of a very efficient cell-based high throughput screening (HTS) method, which utilizes a novel bio-sensor that selectively detects apoptosis based on the fluorescence resonance energy transfer (FRET) technique.
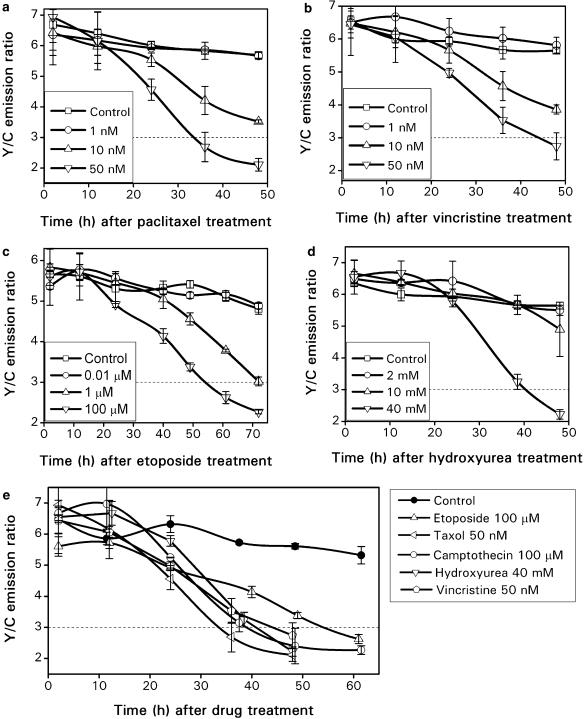
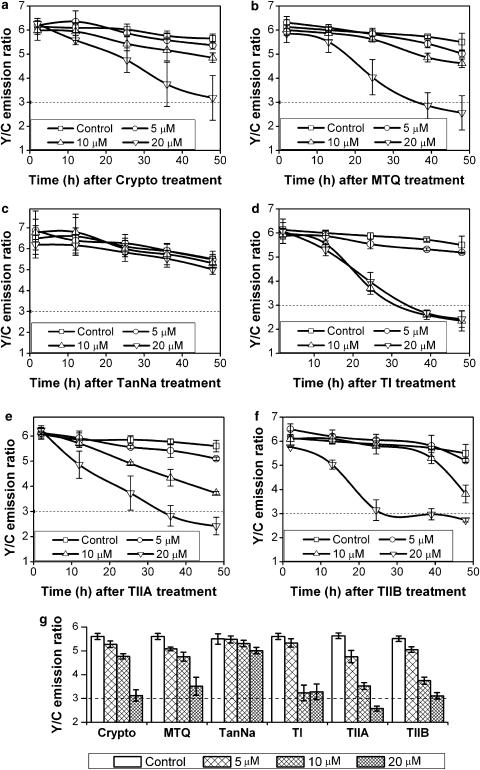
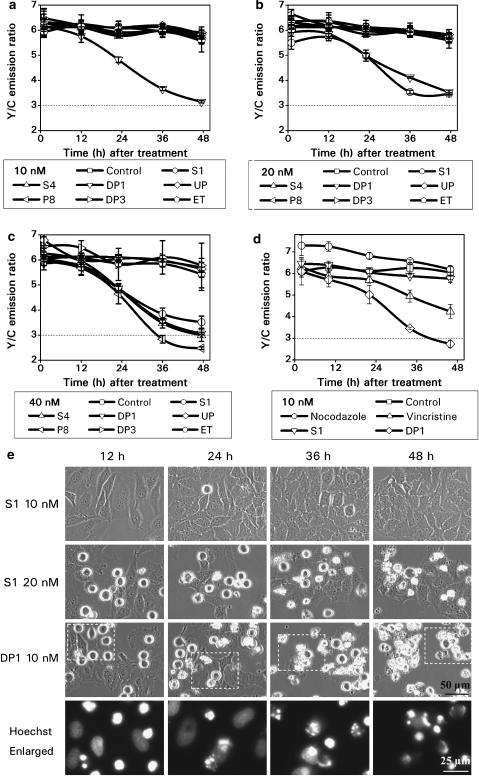
Experimental approach: We generated a stable HeLa cell line expressing a FRET-based bio-sensor protein. When cells undergo apoptosis, they activate a protease called 'caspase-3'. Activation of this enzyme will cleave our sensor protein and cause its fluorescence emission to shift from a wavelength of 535 nm (green) to 486 nm (blue). A decrease in the green/blue emission ratio thus gives a direct indication of apoptosis. The sensor cells are grown in 96-well plates. After addition of different chemical compounds to each well, a fluorescence profile can be measured at various time-points using a fluorescent plate reader. Compounds that can trigger apoptosis are potential candidates as anti-cancer drugs.
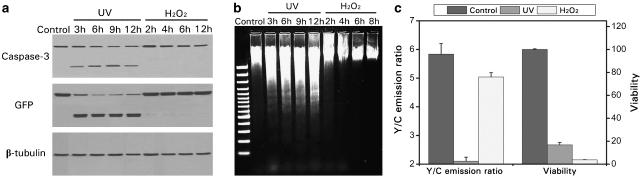
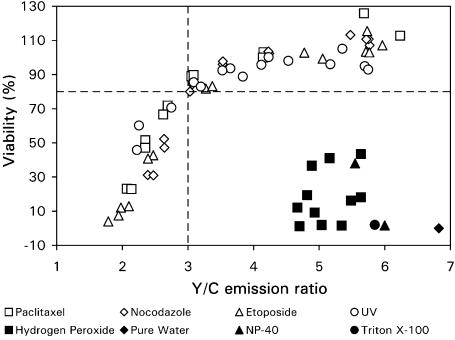
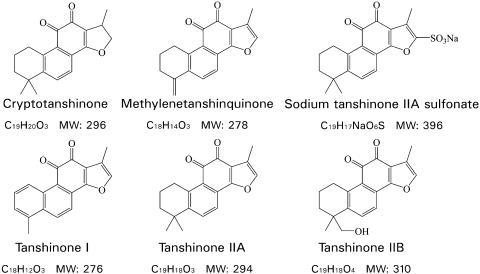
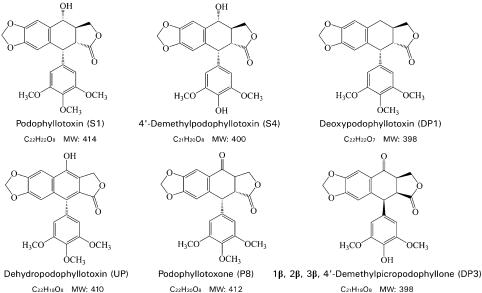
Key results: This novel cell-based HTS method is highly effective in identifying anti-cancer compounds. It was very sensitive in detecting apoptosis induced by various known anti-cancer drugs. Further, this system detects apoptosis, but not necrosis, and is thus more useful than the conventional cell viability assays, such as those using MTT. Finally, we used this system to screen compounds, isolated from two plants used in Chinese medicine, and identified several effective compounds for inducing apoptosis.
Conclusions and implications: This FRET-based HTS method is a powerful tool for identifying anti-cancer compounds and can serve as a highly efficient platform for drug discovery.
Figures
Similar articles
-
A high-throughput fluorescence resonance energy transfer (FRET)-based endothelial cell apoptosis assay and its application for screening vascular disrupting agents.Biochem Biophys Res Commun. 2012 Feb 24;418(4):641-6. doi: 10.1016/j.bbrc.2012.01.066. Epub 2012 Jan 21. Biochem Biophys Res Commun. 2012. PMID: 22290227
-
A high-throughput image-based screen for the identification of Bax/Bak-independent caspase activators against drug-resistant cancer cells.Apoptosis. 2014 Jan;19(1):269-84. doi: 10.1007/s10495-013-0921-8. Apoptosis. 2014. PMID: 24220853
-
Study of endothelial cell apoptosis using fluorescence resonance energy transfer (FRET) biosensor cell line with hemodynamic microfluidic chip system.Lab Chip. 2013 Jul 21;13(14):2693-700. doi: 10.1039/c3lc50105a. Lab Chip. 2013. PMID: 23620256
-
Apoptosis assays for quantifying the bioactivity of anticancer drug products.Drug Resist Updat. 2010 Dec;13(6):172-9. doi: 10.1016/j.drup.2010.09.001. Epub 2010 Oct 13. Drug Resist Updat. 2010. PMID: 20947411 Review.
-
Application of Fluorescence- and Bioluminescence-Based Biosensors in Cancer Drug Discovery.Biosensors (Basel). 2024 Nov 24;14(12):570. doi: 10.3390/bios14120570. Biosensors (Basel). 2024. PMID: 39727835 Free PMC article. Review.
Cited by
-
Drug Screening with Genetically Encoded Fluorescent Sensors: Today and Tomorrow.Int J Mol Sci. 2020 Dec 25;22(1):148. doi: 10.3390/ijms22010148. Int J Mol Sci. 2020. PMID: 33375682 Free PMC article. Review.
-
Trichoderone, a novel cytotoxic cyclopentenone and cholesta-7, 22-diene-3 beta, 5 alpha, 6 beta-triol, with new activities from the marine-derived fungus Trichoderma sp.J Ind Microbiol Biotechnol. 2010 Mar;37(3):245-52. doi: 10.1007/s10295-009-0667-z. J Ind Microbiol Biotechnol. 2010. PMID: 19936812
-
Epigenetic biomarker screening by FLIM-FRET for combination therapy in ER+ breast cancer.Clin Epigenetics. 2019 Jan 30;11(1):16. doi: 10.1186/s13148-019-0620-6. Clin Epigenetics. 2019. PMID: 30700309 Free PMC article.
-
Milestones in the development and implementation of FRET-based sensors of intracellular signals: A biological perspective of the history of FRET.Cell Signal. 2020 Nov;75:109769. doi: 10.1016/j.cellsig.2020.109769. Epub 2020 Sep 6. Cell Signal. 2020. PMID: 32898611 Free PMC article. Review.
-
An enzyme-free FRET nanoprobe for ultrasensitive ketamine detection based on ATP-fueled target recycling.RSC Adv. 2019 Nov 12;9(63):36884-36889. doi: 10.1039/c9ra06139h. eCollection 2019 Nov 11. RSC Adv. 2019. PMID: 35539066 Free PMC article.
References
-
- Berglund K, Johansson BG, Laurell AB, Sjoholm A, Sturfelt G. Inflammatory parameters in rheumatoid arthritis during and after administration of an anti-mitotic agent (Podophyllum lignan derivatives) Scand J Rheumatol. 1978;7:61–63. - PubMed
-
- Bhalla K, Ibrado AM, Tourkina E, Tang C, Mahoney ME, Huang Y. Taxol induces internucleosomal DNA fragmentation associated with programmed cell death in human myeloid leukemia cells. Leukemia. 1993;7:563–568. - PubMed
-
- Bumbasirevic V, Skaro-Milic A, Mircic A, Djuricic B.Apoptosis induced by microtubule disrupting drugs in normal murine thymocytes in vitro Scanning Microsc 19959509–516.discussion 516–518 - PubMed
-
- Cubitt AB, Heim R, Adams SR, Boyd AE, Gross LA, Tsien RY. Understanding, improving and using green fluorescent proteins. Trends Biochem Sci. 1995;20:448–455. - PubMed
-
- Damayanthi Y, Lown JW. Podophyllotoxins: current status and recent developments. Curr Med Chem. 1998;5:205–252. - PubMed
Publication types
MeSH terms
Substances
LinkOut - more resources
Full Text Sources
Other Literature Sources
Research Materials
