. 2007 Feb;150(3):298-312.
doi: 10.1038/sj.bjp.0706987. Epub 2006 Dec 18.

Suberosin inhibits proliferation of human peripheral blood mononuclear cells through the modulation of the transcription factors NF-AT and NF-kappaB

Affiliations

Suberosin inhibits proliferation of human peripheral blood mononuclear cells through the modulation of the transcription factors NF-AT and NF-kappaB

Y-C Chen et al. Br J Pharmacol. 2007 Feb.

Abstract

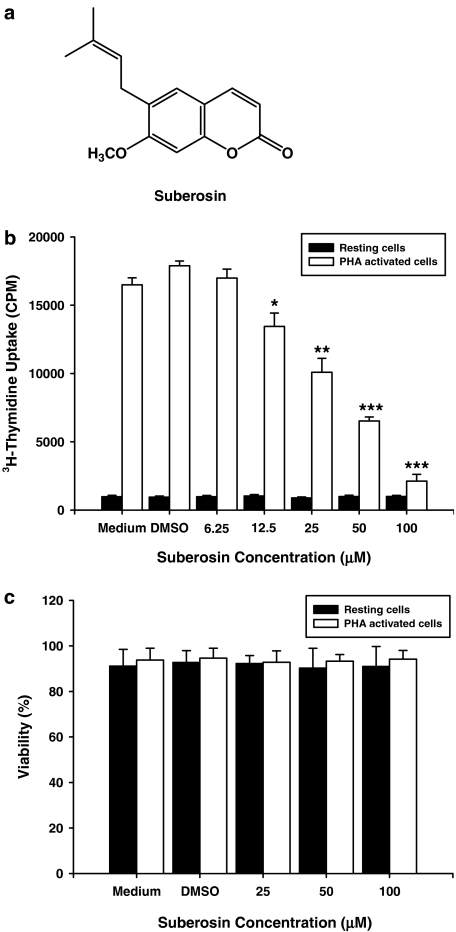
Background and purpose: Extracts of Plumbago zeylanica containing suberosin exhibit anti-inflammatory activity. We purified suberosin from such extracts and studied its effects on a set of key regulatory events in the proliferation of human peripheral blood mononuclear cells (PBMC) stimulated by phytohemagglutinin (PHA).

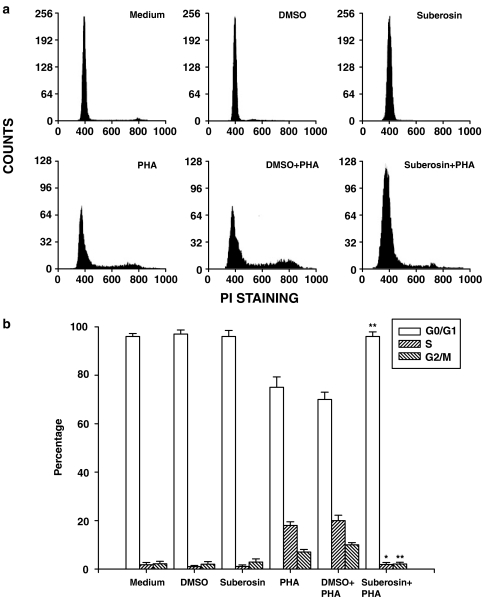
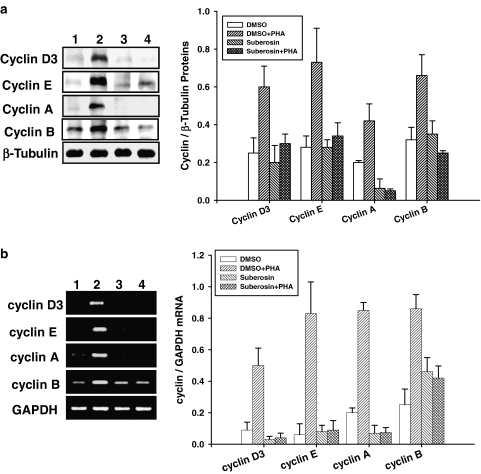
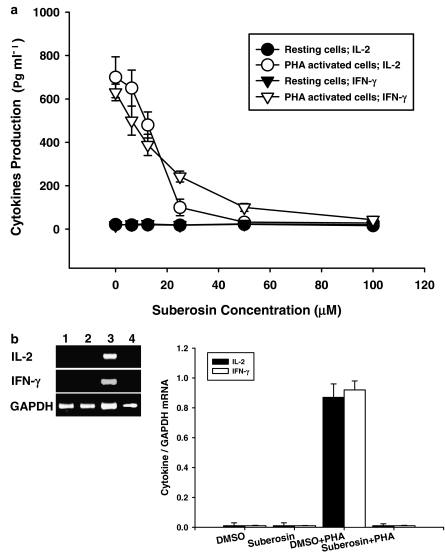
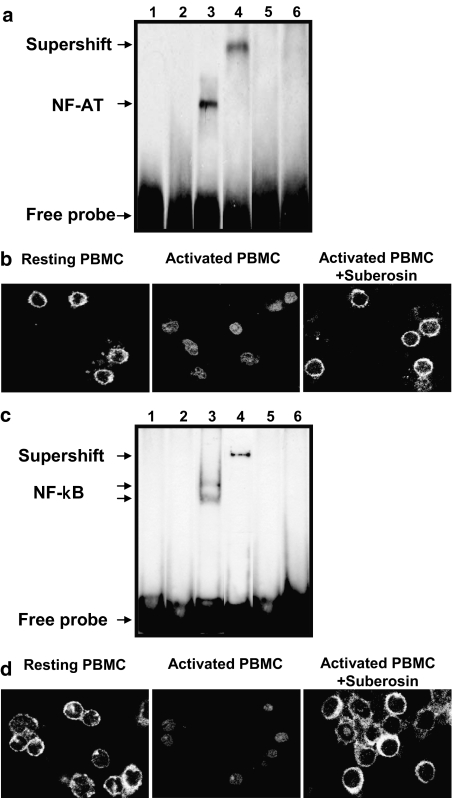
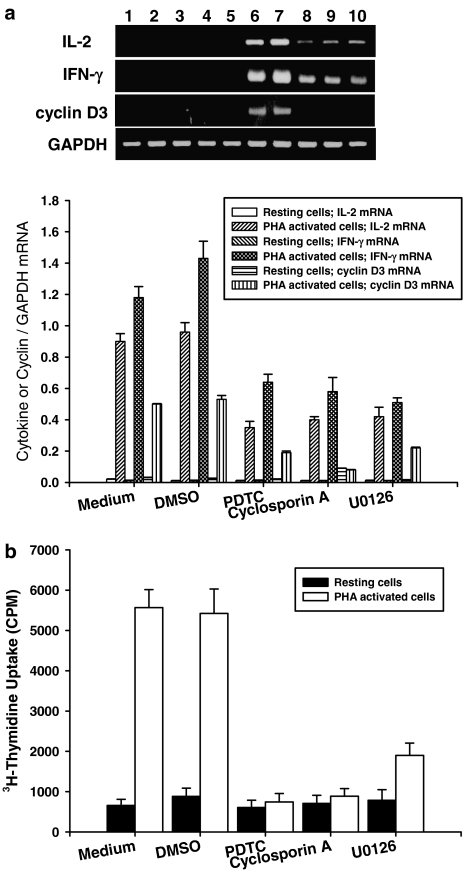
Experimental approach: Proliferation of PBMC in culture was measured by uptake of 3H-thymidine; production of cytokines and cyclins by Western blotting and RT-PCR. Transcription factors NF-AT and NF-kappaB were assayed by immunocytochemistry and EMSA.

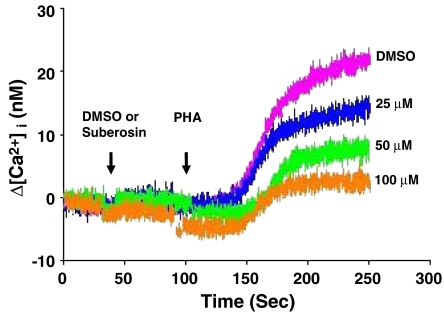
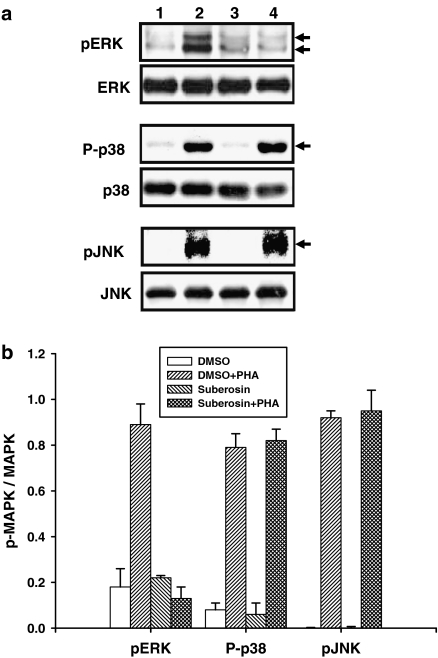
Key results: Suberosin suppressed PHA-induced PBMC proliferation and arrested cell cycle progression from the G1 transition to the S phase. Suberosin suppressed, in activated PBMC, transcripts of interleukin-2 (IL-2), interferon-gamma (IFN-gamma), and cyclins D3, E, A, and B. DNA binding activity and nuclear translocation of NF-AT and NF-kappaB induced by PHA were blocked by suberosin. Suberosin decreased the rise in intracellular Ca2+ concentration ([Ca2+]i) in PBMC stimulated with PHA. Suberosin did not affect phosphorylation of p38 and JNK but did reduce activation of ERK in PHA-treated PBMC. Pharmacological inhibitors of NF-kappaB, NF-AT, and ERK decreased expression of mRNA for the cyclins, IL-2, and IFN-gamma and cell proliferation in PBMC activated by PHA.

Conclusions and implications: The inhibitory effects of suberosin on PHA-induced PBMC proliferation, were mediated, at least in part, through reduction of [Ca2+]i, ERK, NF-AT, and NF-kappaB activation, and early gene expression in PBMC including cyclins and cytokines, and arrest of cell cycle progression in the cells. Our observations provide an explanation for the anti-inflammatory activity of P. zeylanica.


Figures

Figure 1
Figure 1
Suberosin and its effect on PBMC proliferation and viability. (a) The structure of suberosin isolated from P. zeylanica. (b) PBMC (2 × 10⁵ well−1) were treated with the indicated concentrations of suberosin with or without PHA (5 μg ml−1) for 3 days. The proliferation of cells was detected by tritiated thymidine uptake (1 μCi well−1). After a 16-h incubation, the cells were harvested by an automatic harvester, then radioactivity was measured by liquid scintillation counting. (c) PBMC (2 × 10⁵) were stimulated with or without PHA (5 μg ml−1) and treated with medium, 0.1% DMSO, or the indicated concentration of suberosin for 4 days. Numbers of total, viable and non-viable cells were counted after trypan blue staining. Each bar represents the mean±s.d. of three independent experiments with PBMC from different individuals. *P<0.05, **P<0.01, ***P<0.0001: vs the cells treated with DMSO and PHA.
Figure 2
Figure 2
Ability of suberosin to block PBMC progression into the S phase of the cell cycle. PBMC (2 × 10⁶) were treated by 100 μM of suberosin with or without PHA (5 μg ml−1) for 3 days. (a) For determining the cell counts that entered into the cell cycle, cells from a representative subject were stained with propidium iodide, and the DNA content of the cells was analyzed by flow cytometry as described in Methods. (b) A computer program was then used to determine the percentage of PBMC in the G0/G1, S, and G2/M phases. Each bar is the mean±s.d. of three independent experiments with PBMC from different individuals. *P<0.01, **P<0.001: vs the cells treated with DMSO and PHA.
Figure 3
Figure 3
Effects of suberosin on cyclins gene expression in PBMC detected by Western blotting and RT-PCR, respectively. PBMC (1 × 10⁷) were activated with or without PHA in the presence or absence of 100 μM suberosin. (a) Lysates (50 μg of protein) were collected at 24 h and run on a 10% SDS-PAGE gel and analyzed by immunoblotting with anti-cyclin D3, E, A or B antibody. (b) The total cellular RNA was isolated from PBMC at 18 h and analyzed by RT-PCR. (lane1) PBMC treated with DMSO, (lane 2) PBMC treated with DMSO and PHA, (lane 3) PBMC treated with suberosin, (lane 4) PBMC treated with suberosin and PHA. Bar graphs indicates the ratio of cyclin D3, E, A or B to β-tubulin proteins or GAPDH mRNAs, respectively. Each bar represents the mean±s.d. of three independent experiments with PBMC from different individuals.
Figure 4
Figure 4
Cytokine production and mRNA expression in PBMC treated with suberosin. (a) PBMC (2 × 10⁵ well−1) were treated by 0, 6.25, 12.5, 25, 50, and 100 μM of suberosin with or without PHA (5 μg ml−1) for 3 days. Then the cell supernatants were collected and IL-2 and IFN-γ concentration was determined by EIA. Each point is the mean±s.d. of three independent experiments with PBMC from different individuals. (b) PBMC (5 × 10⁶) activated with or without PHA (5 μg ml−1) in the presence or absence of 100 μM suberosin for 18 h. The total cellular RNA was isolated from PBMC treated with DMSO (lane 1), suberosin (lane 2), DMSO and PHA (lane 3), or suberosin and PHA (lane 4). Aliquots of 1 μg of RNA were reverse-transcribed for synthesis of cDNA. Briefly, 10 μl of cDNA was applied in the PCR test. The PCR was carried out as described in Methods. After the reaction, the amplified product was taken out of the tubes and analyzed on 2% agarose gel. Graphical representation of laser densitometry of IL-2 and IFN-γ mRNA expression in resting or PHA-stimulated PBMC in the presence or absence of suberosin. Each band was quantitated using laser-scanning densitometer SLR-2D/1D (Biomed Instruments Inc., Fullerton, CA, USA). The ratio of each cytokine mRNA to GAPDH mRNA was calculated. Each bar is the mean±s.d. of three independent experiments with PBMC from different individuals.
Figure 5
Figure 5
Effects of suberosin on DNA binding activity and nuclear translocation of NF-AT and NF-κB in PBMC detected by EMSA and immunofluorescent staining, respectively. The EMSA was performed as described in the Methods. PBMC (5 × 10⁷) were treated by 100 μM of suberosin with or without PHA (5 μg ml−1) for 1 h. A biotin-labeled (a) NF-AT or (c) NF-κB probe was incubated with nuclear extracts from PBMC treated with 0.1% DMSO (lane 2), DMSO and PHA (lane 3), or suberosin and PHA (lane 6), respectively. The formations of NF-AT/DNA and NF-κB/DNA complexes were detected by streptavidin-HRP conjugate. Lanes 1, 4 and 5 represent the results of adding free probes, anti-NF-ATc1 or anti-NF-κBp65 antibody and a 100-fold excess of unlabeled probe to the reaction mixture, respectively. (b) NF-AT and (d) NF-κB levels in unstimulated PBMC (left panel), and those cultured with (right panel) and without (central panel) suberosin (100 μM) and stimulated with PHA for 1 h, were stained with anti-NF-ATc1 or anti-NF-κBp65 antibody and quantified by confocal microscopy (Leica TCS SP2, Wetzler, Germany).
Figure 6
Figure 6
Effects of suberosin on [Ca2+]i induced in PHA-treated PBMC. PBMC were loaded with 1 μM fura-2-AM at 37°C for 30 min. The cells were then resuspended in RPMI-1640 medium without phenol red to a concentration of 4 × 10⁶ cells ml−1. In each experiment, to 0.5 ml of equilibrated PBMC suspension was added 2.5 μl of DMSO (0.1%) or suberosin (25, 50, or 100 μM) at 40 s, then stimulated with 2.5 μl of PHA (5 μg ml−1) at 100 s and the changes in fluorescence with time recorded. The fluorescent activity was recorded by an F-4500 fluorescence spectrophotometer (Hitachi, Tokyo, Japan) with multi-wavelength time scan program.
Figure 7
Figure 7
Effects of suberosin on the phosphorylation of ERK, p38, and JNK in PBMC. (a) PBMC (1 × 10⁷ cells) were treated with 0.1% DMSO (lane 1), DMSO and 5 μg ml−1 PHA (lane 2), 100 μM suberosin (lane 3), or suberosin and PHA (lane 4), for 60 min. The total cellular proteins (50 μg) were run on a 10% SDS-PAGE gel and analyzed by immunoblotting with anti-pMAPK or MAPK antibody. The representative results from more than three independent experiments are shown. (b) Each band was quantitated by laser-scanning densitometer SLR-2D/1D (Biomed Instruments Inc., Fullerton, USA) and the ratio of pMAPK to MAPK was calculated. Each bar is the mean±s.d. of more than three independent experiments with PBMC from different individuals.
Figure 8
Figure 8
Effects of pharmacological inhibitors on IL-2, IFN-γ and cyclin D3 mRNA expression and cell proliferation in PBMC induced by PHA. (a) 5 × 10⁶ PBMC activated with or without PHA (5 μg ml−1) in the presence or absence of 25 μM PDTC, 2 μM cyclosporin A or 12.5 μM U0126, for 18 h. The total cellular RNA was isolated from PBMC and analyzed by RT-PCR as described in Methods. The lanes indicates PBMC treated with medium (lane 1), 0.1% DMSO (lane 2), PDTC (lane 3), cyclosporin A (lane 4), U0126 (lane 5), PHA (lane 6), DMSO and PHA (lane 7), PDTC and PHA (lane 8), cyclosporin A and PHA (lane 9), and U0126 and PHA (lane 10). Following the reaction, the amplified products were taken out of the tubes and run on 2% agarose gel. Each band was quantitated using laser-scanning densitometer SLR-2D/1D (Biomed Instruments Inc., Fullerton, USA). Graphical representation of laser densitometry of IL-2, IFN-γ and cyclin D3 mRNA expression in unstimulated or PHA-stimulated PBMC in the presence or absence of various inhibitors. (b) For PBMC proliferation, the cells (2 × 10⁵ well−1) were treated by 25 μM PDTC, 2 μM cyclosporin A or 12.5 μM U0126 with or without PHA (5 μg ml−1) for 3 days. The proliferation of cells was detected by tritiated thymidine uptake (1 μCi well−1). After a 16-h incubation, the cells were harvested by an automatic harvester, then radioactivity was measured by liquid scintillation counting. Each bar represents the mean±s.d. of three independent experiments with PBMC from different individuals.

References

    1. Ahsan M, Zaman TA, Hasan CM, Ito C, Islam SK. Constituents and cytotoxicity of Zanthoxylum rhesta stem bark. Fitoterapia. 2000;71:697–700. - PubMed
    1. Ajchenbaum F, Ando K, DeCaprio JA, Griffin JD. Independent regulation of human D-type cyclin gene expression during G1 phase in primary human T lymphocytes. J Biol Chem. 1993;268:4113–4119. - PubMed
    1. Arai K, Lee F, Miyajima A. Cytokines: Coordinators of immune and inflammatory response. Annu Rev Biochem. 1990;59:783–836. - PubMed
    1. Arnaud M, Crouin C, Deon C, Loyaux D, Bertoglio J. Phosphorylation of Grb2-associated binder 2 on serine 623 by ERK MAPK regulates its association with phosphatase SHP-2 and decreases STAT5 activation. J Immunol. 2004;173:3962–3971. - PubMed
    1. Buggins AGS, Milojkovic D, Arno MJ, Lea NC, Mufti GJ, Thomas NSB, et al. Microenvironment produced by acute myeloid leukemia cells prevents T cell activation and proliferation by inhibition of NF-κB, c-Myc, and pRb pathways. J Immunol. 2001;167:6021–6030. - PubMed

Publication types

MeSH terms