

Wait times for breast cancer care
- PMID: 17179986
- PMCID: PMC2360218
- DOI: 10.1038/sj.bjc.6603523
Wait times for breast cancer care
Abstract
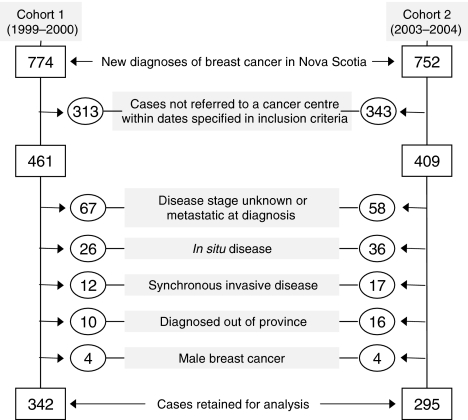
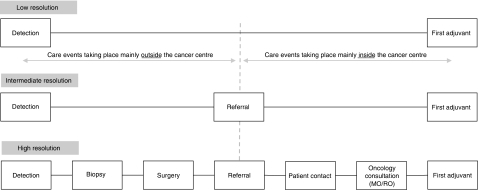
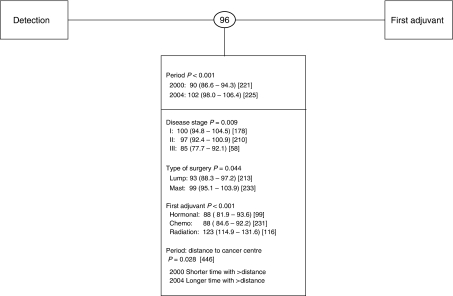
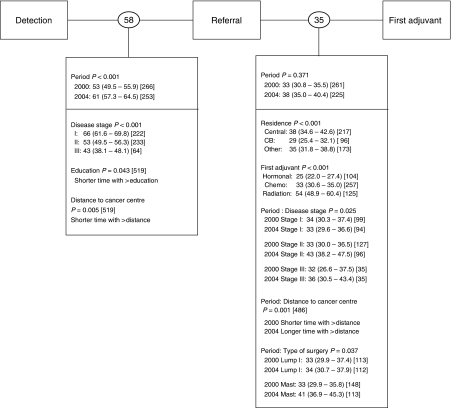
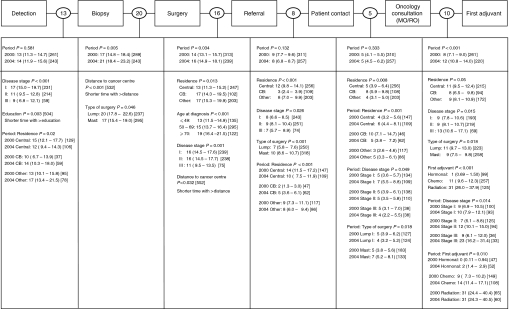
Measurement of care time intervals is complex, being influenced by many factors. The definition of the care interval monitored can also bias the detection of changes in waits. The implications of using different care interval definitions to report wait times and identify delays in care provision were examined using a retrospective chart review of 637 women with surgically treated breast cancer who were referred to a cancer centre between September 1999 and 2000 or September 2003 and 2004. Overall waits between detection and adjuvant treatment increased by 12 days over the two periods, but their exact location and cause(s) could not be determined at such a low-resolution interval. At higher resolutions of care intervals, reporting the comprehensive sequence of care events, the prolongation was mainly associated with delayed access to surgery (4 days) and delivery of adjuvant chemotherapy (4 days). The latter went unnoticed when waits were reported at intermediate (referral to adjuvant treatment) and low (detection to adjuvant treatment) resolutions. Disease stage and type of first adjuvant treatment consistently and significantly influenced the length of waits. Comprehensive monitoring of the entire care path is essential to effectively prioritize interventions, assess their outcomes and optimise access to cancer care.
Figures
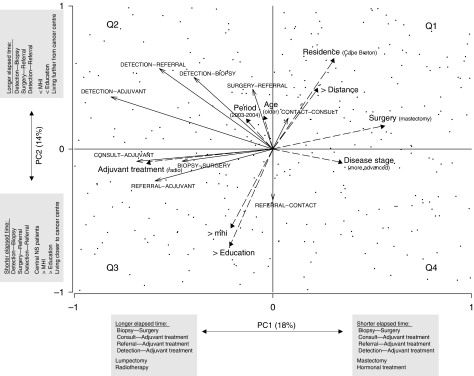
 ). Longer arrows indicate stronger influences. Arrows pointing in the same directions indicate strong co-associations. Arrows of care intervals point in the direction of increasing wait times. Arrows for categorical cofactors point in the direction of the highest classification order as described in Table 1. PC1 and PC2 accounted for 18 and 14% of the total variance in the data, respectively. Patients (cases) appear as points. Patients clustering in the second quadrant were generally from Cape Breton, living further from a cancer centre, with lower education and income levels, undergoing lumpectomy and receiving radiation therapy as first adjuvant treatment and experiencing prolonged elapsed times in most care intervals with the exception of Referral–Patient Contact. Most wait times were oriented (increasing) in the same direction as the period effect, highlighting the general (although not necessarily statistically significant) prolongation of wait times in most care intervals.
References
-
- Armitage P, Berry G (1994) Statistical Methods in Medical Research. 3rd edn. Oxford: Blackwell Science
-
- Canadian Institute for Health Information (2006) Waiting for Health Care in Canada: What we Know and What We don't know. Ottawa, March. 2006. ISBN: 1-55392-784-2
-
- Legendre P, Legendre L (1998) Numerical Ecology. Amsterdam, Netherlands: Elsevier
-
- Manly B (1986) Multivariate Statistical Methods, a Primer. New York: Chapman & Hall
Publication types
MeSH terms
LinkOut - more resources
Full Text Sources
Medical
