

Enhanced diffusion of uranium and thorium linked to crystal plasticity in zircon
- PMID: 17181855
- PMCID: PMC1769485
- DOI: 10.1186/1467-4866-7-10
Enhanced diffusion of uranium and thorium linked to crystal plasticity in zircon
Abstract
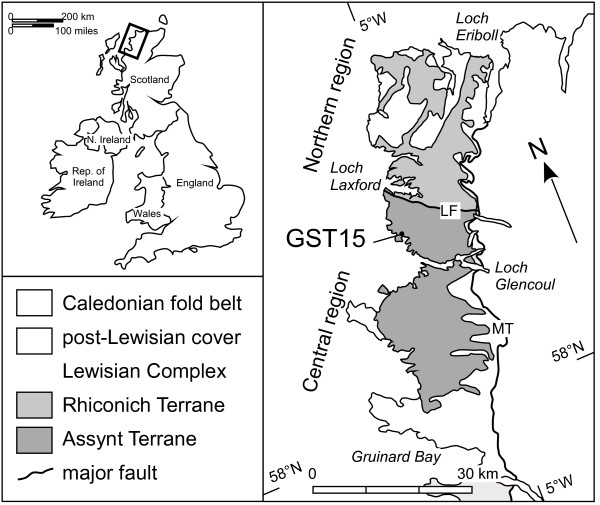
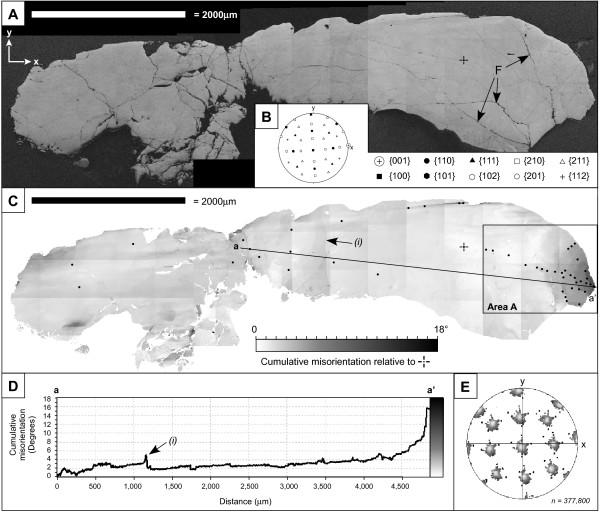
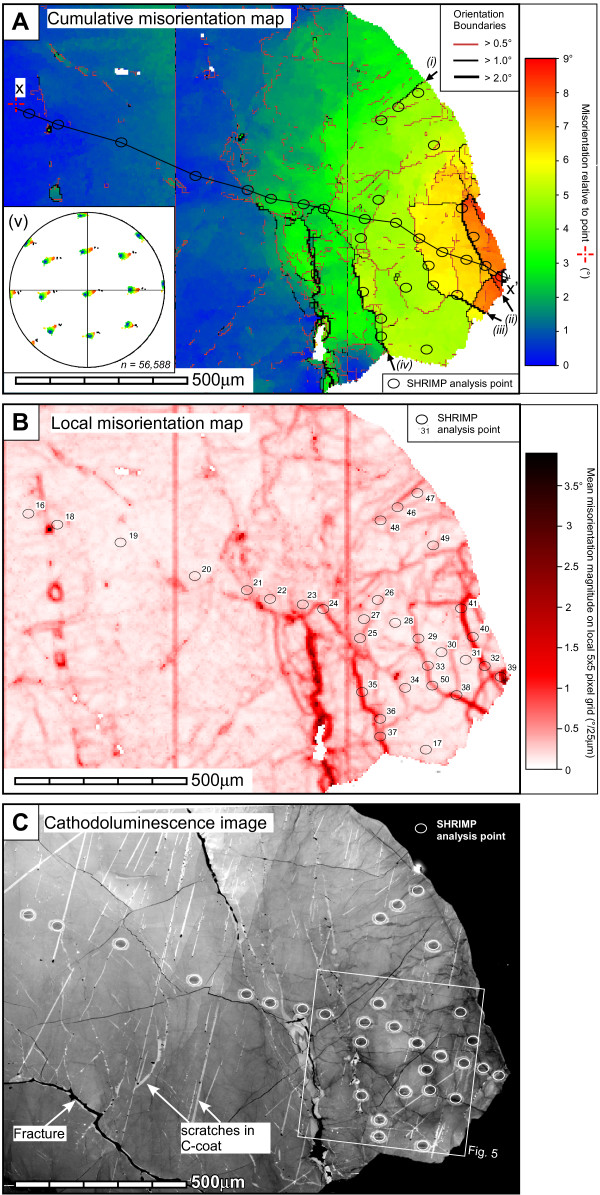
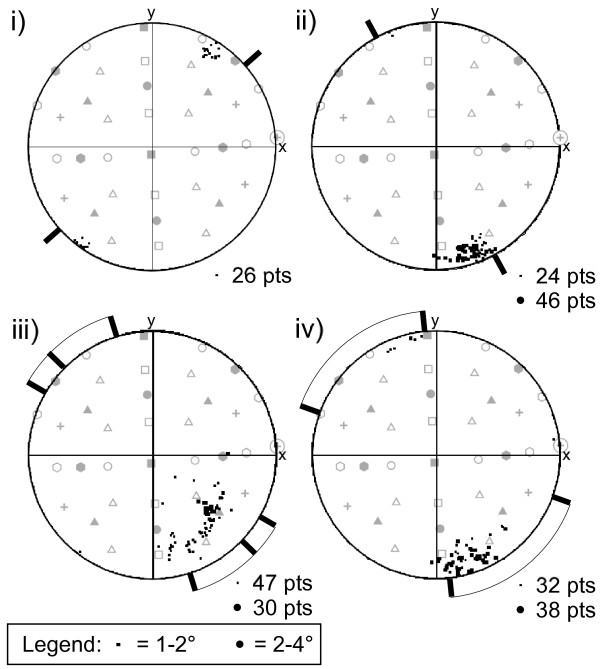
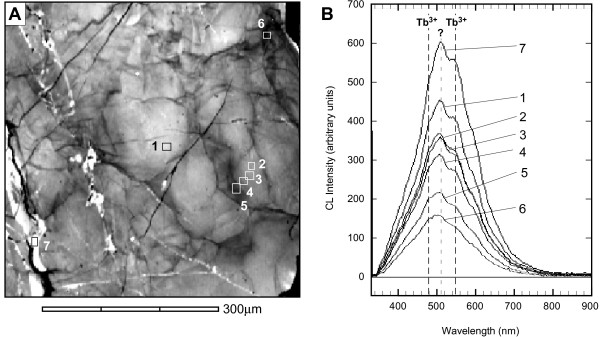
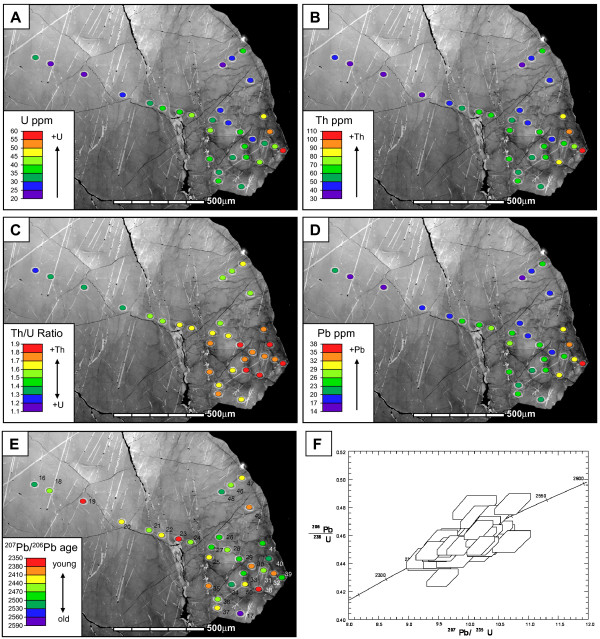
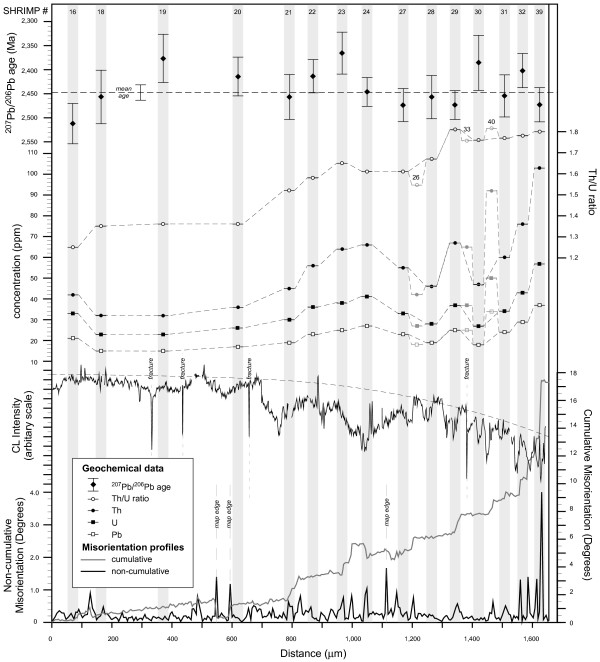
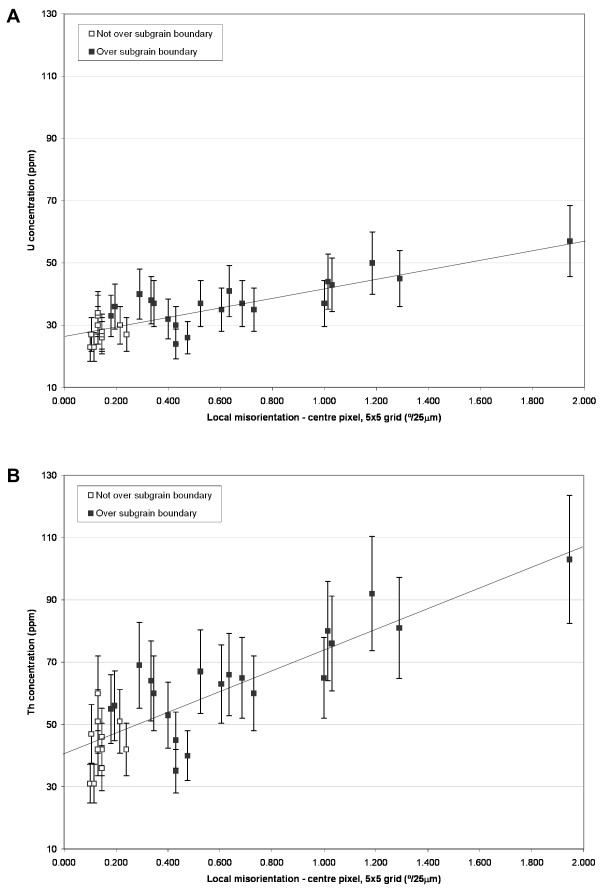
The effects of crystal-plasticity on the U-Th-Pb system in zircon is studied by quantitative microstructural and microchemical analysis of a large zircon grain collected from pyroxenite of the Lewisian Complex, Scotland. Electron backscatter diffraction (EBSD) mapping reveals a c.18 degree variation in crystallographic orientation that comprises both a gradual change in orientation and a series of discrete low-angle (<4 degrees) boundaries. These microstructural data are consistent with crystal-plastic deformation of zircon associated with the formation and migration of dislocations. A heterogeneous pattern of dark cathodoluminescence, with the darkest domains coinciding with low-angle boundaries, mimics the deformation microstructure identified by EBSD. Geochemical data collected using the Sensitive High Resolution Ion MicroProbe (SHRIMP) shows a positive correlation between concentrations of the elements U, Th and Pb (ranging from 20-60 ppm, 30-110 ppm, and 14-36 ppm, respectively) and Th/U ratio (1.13-1.8) with the deformation microstructure. The highest measured concentrations and Th/U coincide with low-angle boundaries. This enrichment is interpreted to reflect enhanced bulk diffusion of U and Th due to the formation and migration of high-diffusivity dislocations. 207Pb/206Pb ages for individual analyses show no significant variation across the grain, and define a concordant, combined mean age of 2451 +/- 14 Ma. This indicates that the grain was deformed shortly after initial crystallization, most probably during retrograde Inverian metamorphism at amphibolite facies conditions. The elevated Th over U and consistent 207Pb/206Pb ages indicates that deformation most likely occurred in the presence of a late-stage magmatic fluid that drove an increase in the Th/U during deformation. The relative enrichment of Th over U implies that Th/U ratio may not always be a robust indicator of crystallization environment. This study provides the first evidence of deformation-related modification of the U-Th system in zircon and has fundamental implications for the application and interpretation of zircon trace element data.
Figures
Similar articles
-
Deformation-induced trace element redistribution in zircon revealed using atom probe tomography.Nat Commun. 2016 Feb 12;7:10490. doi: 10.1038/ncomms10490. Nat Commun. 2016. PMID: 26868040 Free PMC article.
-
Seeing is believing: Visualization of He distribution in zircon and implications for thermal history reconstruction on single crystals.Sci Adv. 2017 Feb 10;3(2):e1601121. doi: 10.1126/sciadv.1601121. eCollection 2017 Feb. Sci Adv. 2017. PMID: 28246632 Free PMC article.
-
The effect of low-temperature annealing on discordance of U-Pb zircon ages.Sci Rep. 2021 Mar 29;11(1):7079. doi: 10.1038/s41598-021-86449-y. Sci Rep. 2021. PMID: 33782468 Free PMC article.
-
Late-Proterozoic to Paleozoic history of the peri-Gondwana Calabria-Peloritani Terrane inferred from a review of zircon chronology.Springerplus. 2016 Feb 29;5:212. doi: 10.1186/s40064-016-1839-8. eCollection 2016. Springerplus. 2016. PMID: 27026906 Free PMC article. Review.
-
In-Situ U-Pb Dating of Apatite by Hiroshima-SHRIMP: Contributions to Earth and Planetary Science.Mass Spectrom (Tokyo). 2012;1(2):A0011. doi: 10.5702/massspectrometry.A0011. Epub 2012 Nov 16. Mass Spectrom (Tokyo). 2012. PMID: 24349912 Free PMC article. Review.
Cited by
-
Metasomatism and the crystallization of zircon megacrysts in Archaean peridotites from the Lewisian complex, NW Scotland.Contrib Mineral Petrol. 2018;173(12):99. doi: 10.1007/s00410-018-1527-5. Epub 2018 Nov 17. Contrib Mineral Petrol. 2018. PMID: 30930466 Free PMC article.
-
Deformation-induced trace element redistribution in zircon revealed using atom probe tomography.Nat Commun. 2016 Feb 12;7:10490. doi: 10.1038/ncomms10490. Nat Commun. 2016. PMID: 26868040 Free PMC article.
References
-
- Corfu F, Hanchar JM, Hoskin PWO, Kinny P. Atlas of Zircon Textures. Reviews in Mineralogy and Geochemistry. 2003;53:469–500. doi: 10.2113/0530469. - DOI
-
- Hoskin PWO, Schaltegger U. The composition of zircon and igneous and metamorphic petrogenesis. In: Hanchar JM, Hoskin PWO, editor. Zircon. 53. 2003. pp. 27–62. (Reviews in Mineralogy and Geochemistry, v. 53). Ribbe PH, Rosso JJ.
-
- Schärer U, Allègre CJ. Uranium-lead system in fragments of a single zircon grain. Nature. 1982;295:585–587. doi: 10.1038/295585a0. - DOI
-
- Froude DO, Ireland TR, Kinny PD, Williams IS, Compston W, Williams IR, Myers IS. Ion microprobe identifications of 4100-4200 M yr-old terrestrial zircons. Nature. 1983;304:616–618. doi: 10.1038/304616a0. - DOI
-
- Fedo CM, Sircombe KN, Rainbird RH. Detrital zircon analysis of the sedimentary record. In: Hanchar JM, Hoskin PWO, editor. Zircon. 53. 2003. pp. 277–303. (Reviews in Mineralogy and Geochemistry, v. 53). Ribbe PH, Rosso JJ.
LinkOut - more resources
Full Text Sources
