

Systematic interpretation of microarray data using experiment annotations
- PMID: 17181856
- PMCID: PMC1774576
- DOI: 10.1186/1471-2164-7-319
Systematic interpretation of microarray data using experiment annotations
Abstract
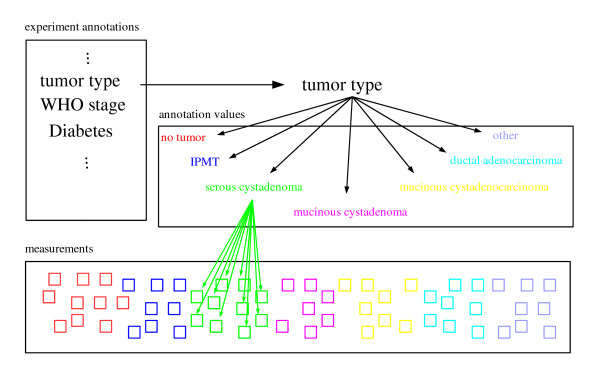
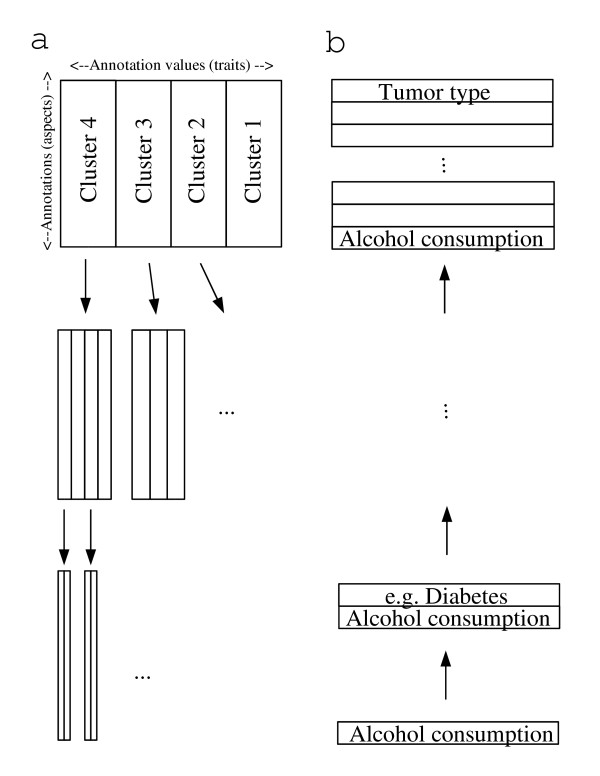
Background: Up to now, microarray data are mostly assessed in context with only one or few parameters characterizing the experimental conditions under study. More explicit experiment annotations, however, are highly useful for interpreting microarray data, when available in a statistically accessible format.
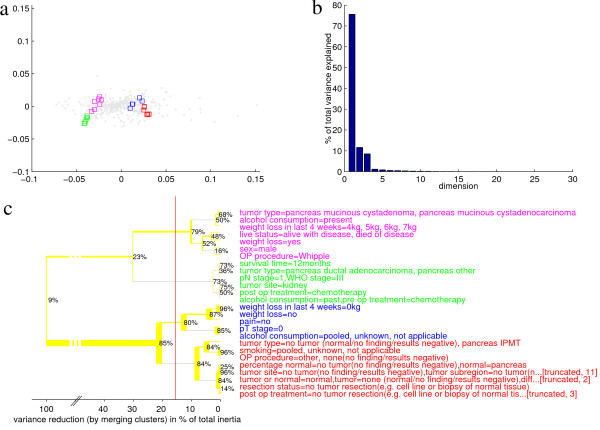
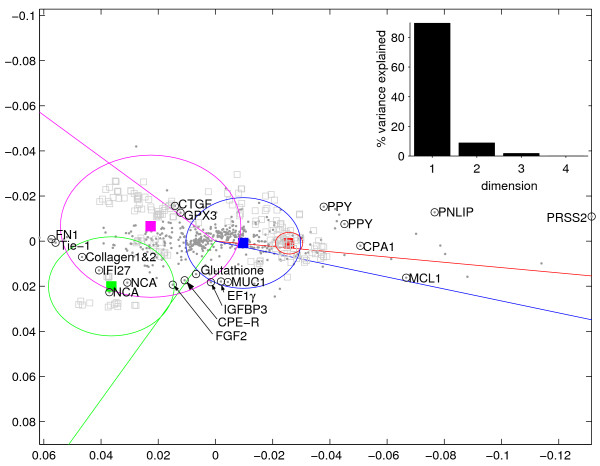
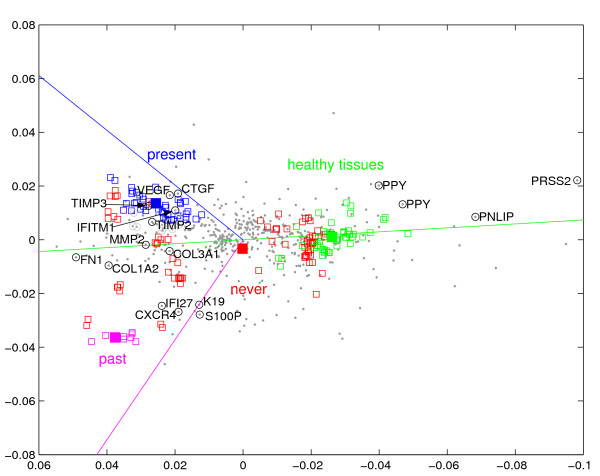
Results: We provide means to preprocess these additional data, and to extract relevant traits corresponding to the transcription patterns under study. We found correspondence analysis particularly well-suited for mapping such extracted traits. It visualizes associations both among and between the traits, the hereby annotated experiments, and the genes, revealing how they are all interrelated. Here, we apply our methods to the systematic interpretation of radioactive (single channel) and two-channel data, stemming from model organisms such as yeast and drosophila up to complex human cancer samples. Inclusion of technical parameters allows for identification of artifacts and flaws in experimental design.
Conclusion: Biological and clinical traits can act as landmarks in transcription space, systematically mapping the variance of large datasets from the predominant changes down toward intricate details.
Figures
Similar articles
-
Integration of GO annotations in Correspondence Analysis: facilitating the interpretation of microarray data.Bioinformatics. 2005 May 15;21(10):2424-9. doi: 10.1093/bioinformatics/bti367. Epub 2005 Mar 3. Bioinformatics. 2005. PMID: 15746280
-
Analysis of DNA microarray data.Curr Top Med Chem. 2004;4(13):1357-70. doi: 10.2174/1568026043387773. Curr Top Med Chem. 2004. PMID: 15379650 Review.
-
Global rank-invariant set normalization (GRSN) to reduce systematic distortions in microarray data.BMC Bioinformatics. 2008 Dec 4;9:520. doi: 10.1186/1471-2105-9-520. BMC Bioinformatics. 2008. PMID: 19055840 Free PMC article.
-
Evaluating concentration estimation errors in ELISA microarray experiments.BMC Bioinformatics. 2005 Jan 26;6:17. doi: 10.1186/1471-2105-6-17. BMC Bioinformatics. 2005. PMID: 15673468 Free PMC article.
-
Clustering microarray data.Methods Enzymol. 2006;411:194-213. doi: 10.1016/S0076-6879(06)11010-1. Methods Enzymol. 2006. PMID: 16939791 Review.
Cited by
-
Dual-color proteomic profiling of complex samples with a microarray of 810 cancer-related antibodies.Mol Cell Proteomics. 2010 Jun;9(6):1271-80. doi: 10.1074/mcp.M900419-MCP200. Epub 2010 Feb 16. Mol Cell Proteomics. 2010. PMID: 20164060 Free PMC article.
-
Identification of differentially expressed subnetworks based on multivariate ANOVA.BMC Bioinformatics. 2009 Apr 30;10:128. doi: 10.1186/1471-2105-10-128. BMC Bioinformatics. 2009. PMID: 19405941 Free PMC article.
-
Exploring the transcription factor activity in high-throughput gene expression data using RLQ analysis.BMC Bioinformatics. 2013 Jun 6;14:178. doi: 10.1186/1471-2105-14-178. BMC Bioinformatics. 2013. PMID: 23742070 Free PMC article.
-
Comparative analysis of missing value imputation methods to improve clustering and interpretation of microarray experiments.BMC Genomics. 2010 Jan 7;11:15. doi: 10.1186/1471-2164-11-15. BMC Genomics. 2010. PMID: 20056002 Free PMC article.
References
-
- Gene Expression Omnibus (GEO) http://www.ncbi.nlm.nih.gov/projects/geo
-
- ArrayExpress http://www.ebi.ac.uk/arrayexpress
-
- Microarray Gene Expression Data Society http://www.mged.org
Publication types
MeSH terms
LinkOut - more resources
Full Text Sources
