

Chemoresistance induces enhanced adhesion and transendothelial penetration of neuroblastoma cells by down-regulating NCAM surface expression
- PMID: 17181871
- PMCID: PMC1780063
- DOI: 10.1186/1471-2407-6-294
Chemoresistance induces enhanced adhesion and transendothelial penetration of neuroblastoma cells by down-regulating NCAM surface expression
Abstract
Background: Drug resistance to chemotherapy is often associated with increased malignancy in neuroblastoma (NB). One explanation for the link between resistance and malignancy might be that resistance facilitates cancer progression and invasion. To investigate this hypothesis, adhesion, transendothelial penetration and NCAM (CD56) adhesion receptor expression of drug-resistant versus drug-sensitive NB tumor cells were evaluated.
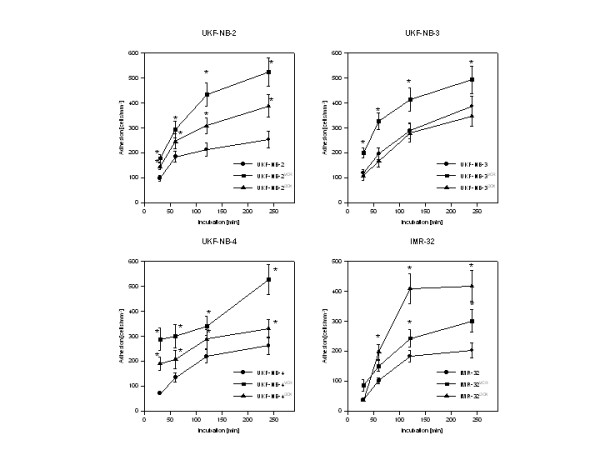
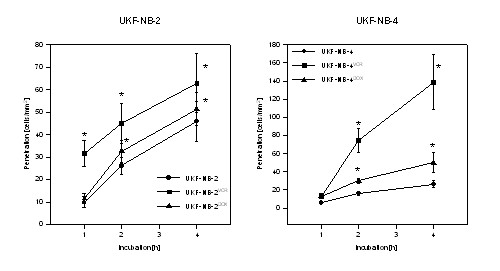
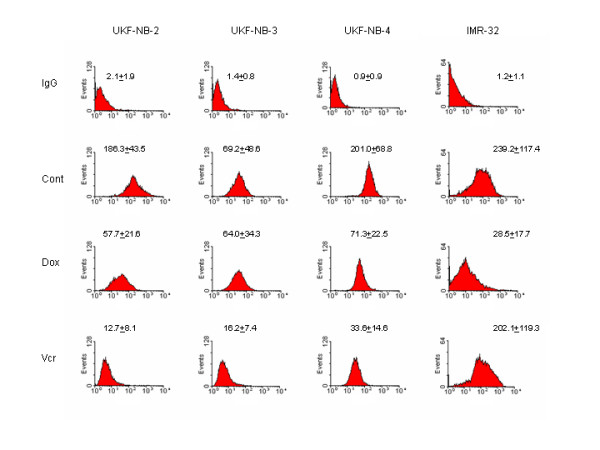
Methods: Acquired drug resistance was mimicked by exposing parental UKF-NB-2, UKF-NB-3 or IMR-32 tumor cells to increasing concentrations of vincristine- (VCR) or doxorubicin (DOX) to establish the resistant tumor cell sublines UKF-NB-2VCR, UKF-NB-2DOX, UKF-NB-3VCR, UKF-NB-3DOX, IMR-32VCR and IMR-32DOX. Additionally, the malignant behaviour of UKF-NB-4, which already possessed the intrinsic multidrug resistance (MDR) phenotype, was analyzed. UKF-NB-4 exposed to VCR or DOX were designated UKF-NB-4VCR or UKF-NB-4DOX. Combined phase contrast - reflection interference contrast microscopy was used to separately evaluate NB cell adhesion and penetration. NCAM was analyzed by flow cytometry, western blot and RT-PCR.
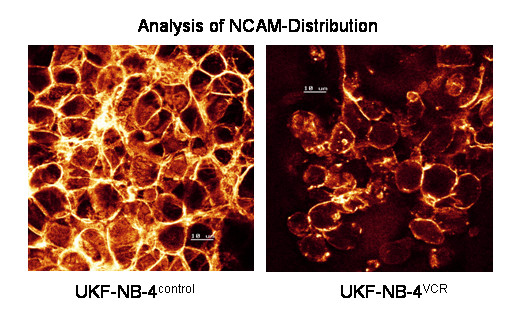
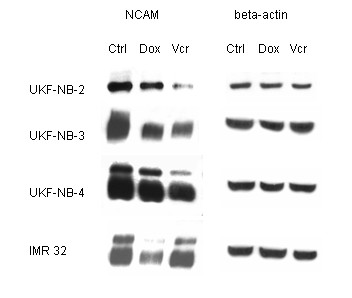
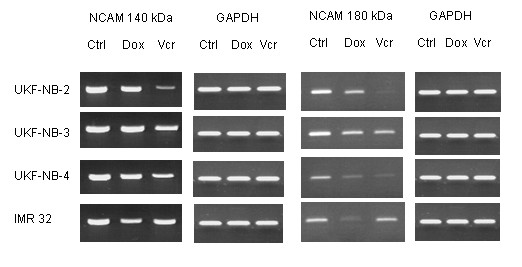
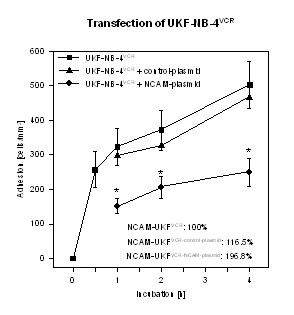
Results: VCR and DOX resistant tumor sublines showed enhanced adhesion and penetration capacity, compared to their drug naïve controls. Strongest effects were seen with UKF-NB-2VCR, UKF-NB-3VCR and IMR-32DOX. DOX or VCR treatment also evoked increased invasive behaviour of UKF-NB-4. The process of accelerated tumor invasion was accompanied by decreased NCAM surface and protein expression, and down-regulation of NCAM coding mRNA. Transfection of UKF-NB-4VCR cells with NCAM cDNA led to a significant receptor up-regulation, paralleled by diminished adhesion to an endothelial cell monolayer.
Conclusion: It is concluded that NB cells resistant to anticancer drugs acquire increased invasive capacity relative to non-resistant parental cells, and that enhanced invasion is caused by strong down-regulation of NCAM adhesion receptors.
Figures
Similar articles
-
Valproic acid inhibits adhesion of vincristine- and cisplatin-resistant neuroblastoma tumour cells to endothelium.Br J Cancer. 2007 Jun 4;96(11):1699-706. doi: 10.1038/sj.bjc.6603777. Epub 2007 May 15. Br J Cancer. 2007. PMID: 17505515 Free PMC article.
-
Development of resistance to vincristine and doxorubicin in neuroblastoma alters malignant properties and induces additional karyotype changes: a preclinical model.Int J Cancer. 2003 Mar 10;104(1):36-43. doi: 10.1002/ijc.10917. Int J Cancer. 2003. PMID: 12532417
-
Increased malignant behavior in neuroblastoma cells with acquired multi-drug resistance does not depend on P-gp expression.Int J Oncol. 2005 Oct;27(4):1029-37. Int J Oncol. 2005. PMID: 16142320
-
The neural cell adhesion molecule NCAM in multiple myeloma.Leuk Lymphoma. 1996 Feb;20(5-6):389-95. doi: 10.3109/10428199609052420. Leuk Lymphoma. 1996. PMID: 8833394 Review.
-
[Prevalence of CD56 /NCAM molecule in nervous system immune system and endocrine glands--accidental coincidence?].Endokrynol Pol. 2005 Jan-Feb;56(1):78-82. Endokrynol Pol. 2005. PMID: 16335677 Review. Polish.
Cited by
-
Soluble factors released by activated cytotoxic T lymphocytes interfere with death receptor pathways in neuroblastoma.Cancer Immunol Immunother. 2008 May;57(5):731-43. doi: 10.1007/s00262-007-0412-2. Epub 2007 Oct 26. Cancer Immunol Immunother. 2008. PMID: 17962944 Free PMC article.
-
Relevance of activated leukocyte cell adhesion molecule (ALCAM) in tumor tissue and sera of cervical cancer patients.BMC Cancer. 2012 Apr 4;12:140. doi: 10.1186/1471-2407-12-140. BMC Cancer. 2012. PMID: 22475274 Free PMC article.
-
Phosphorylation of ephrin-B1 regulates dissemination of gastric scirrhous carcinoma.Am J Pathol. 2007 Jul;171(1):68-78. doi: 10.2353/ajpath.2007.070033. Am J Pathol. 2007. PMID: 17591954 Free PMC article.
-
New approaches to pharmacotherapy of tumors of the nervous system during childhood and adolescence.Pharmacol Ther. 2009 Apr;122(1):44-55. doi: 10.1016/j.pharmthera.2009.01.001. Epub 2009 Jan 23. Pharmacol Ther. 2009. PMID: 19318043 Free PMC article. Review.
-
Pharmacotherapy for adults with tumors of the central nervous system.Pharmacol Ther. 2009 Mar;121(3):253-64. doi: 10.1016/j.pharmthera.2008.11.003. Epub 2008 Nov 27. Pharmacol Ther. 2009. PMID: 19091301 Free PMC article. Review.
References
-
- Keshelava N, Seeger RC, Groshen S, Reynolds CP. Drug resistance patterns of human neuroblastoma cell lines derived from patients at different phases of therapy. Cancer Res. 1998;58:5396–405. - PubMed
-
- Serretta V, Pavone C, Allegro R, Vella M, Sanguedolce R, Porcasi R, Morello V, Tomasino RM, Pavone-Macaluso M. Correlation between GP-170 expression, prognosis, and chemoresistance of superficial bladder carcinoma. J Cancer Res Clin Oncol. 2003;129:472–6. doi: 10.1007/s00432-003-0455-5. - DOI - PubMed
-
- Gaumann A, Tews DS, Mentzel T, Petrow PK, Mayer E, Otto M, Kirkpatrick CJ, Kriegsmann J. Expression of drug resistance related proteins in sarcomas of the pulmonary artery and poorly differentiated leiomyosarcomas of other origin. Virchows Arch. 2003;442:529–37. - PubMed
Publication types
MeSH terms
Substances
LinkOut - more resources
Full Text Sources
Medical
Research Materials
Miscellaneous
