

Methylmercury induces oxidative injury, alterations in permeability and glutamine transport in cultured astrocytes
- PMID: 17182013
- PMCID: PMC1847599
- DOI: 10.1016/j.brainres.2006.10.070
Methylmercury induces oxidative injury, alterations in permeability and glutamine transport in cultured astrocytes
Abstract
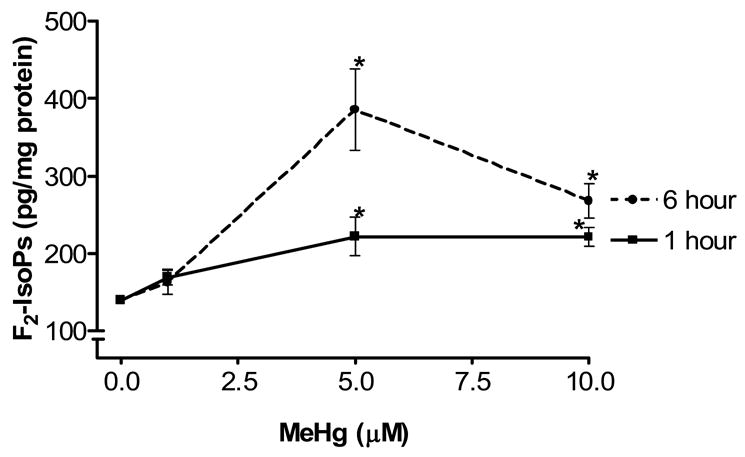
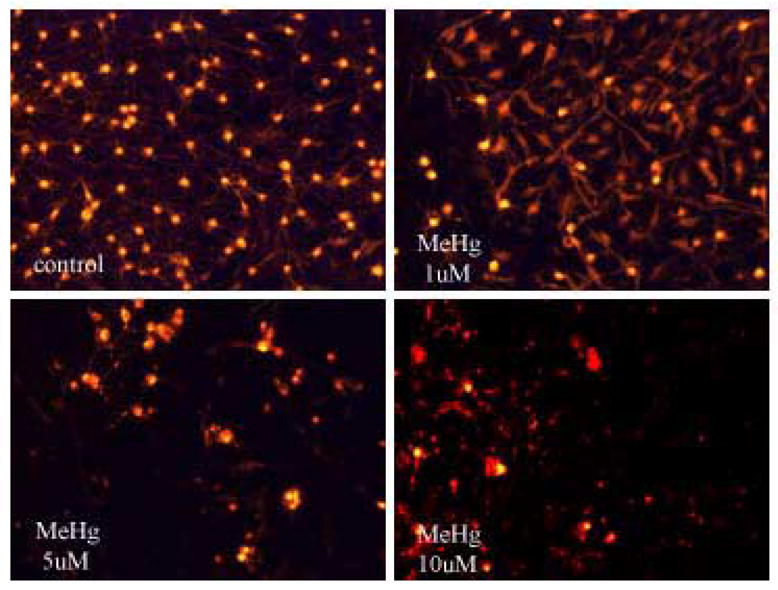
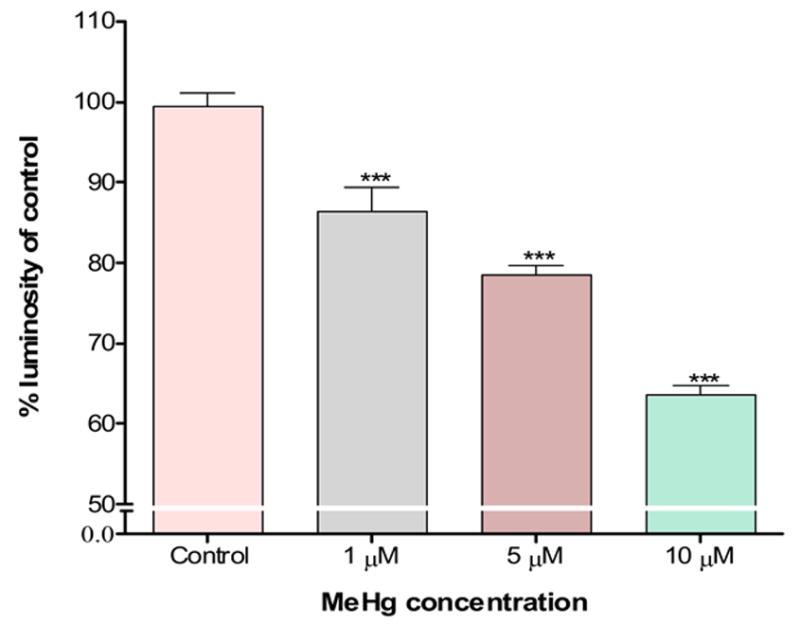
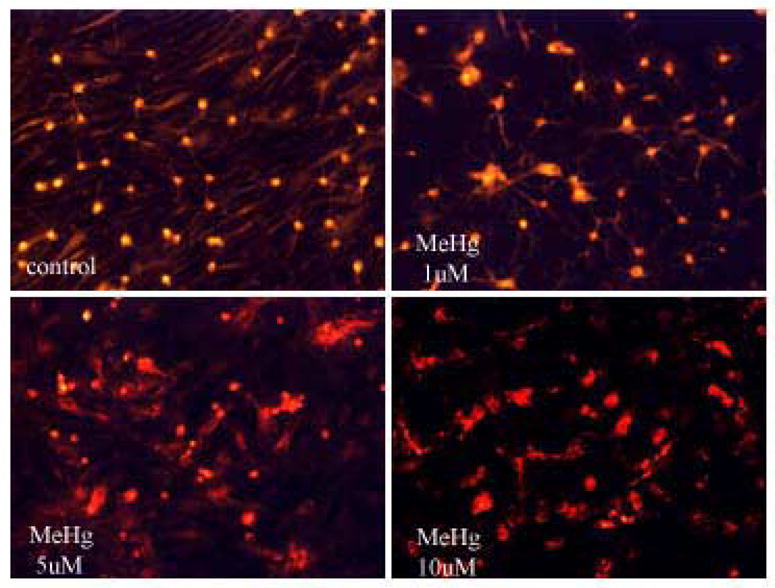
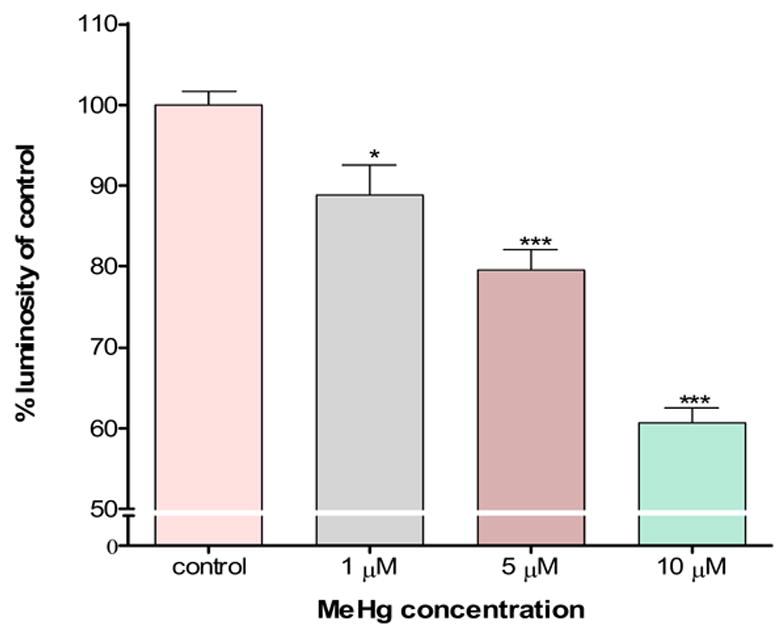
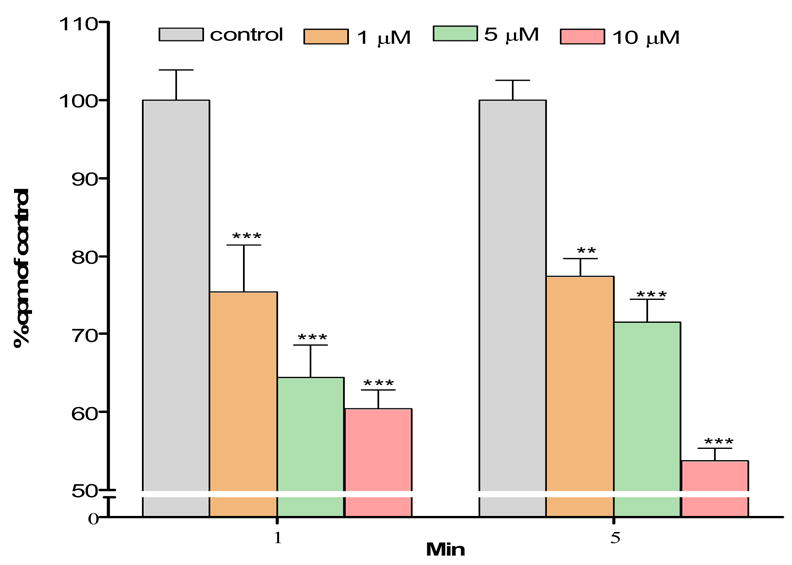
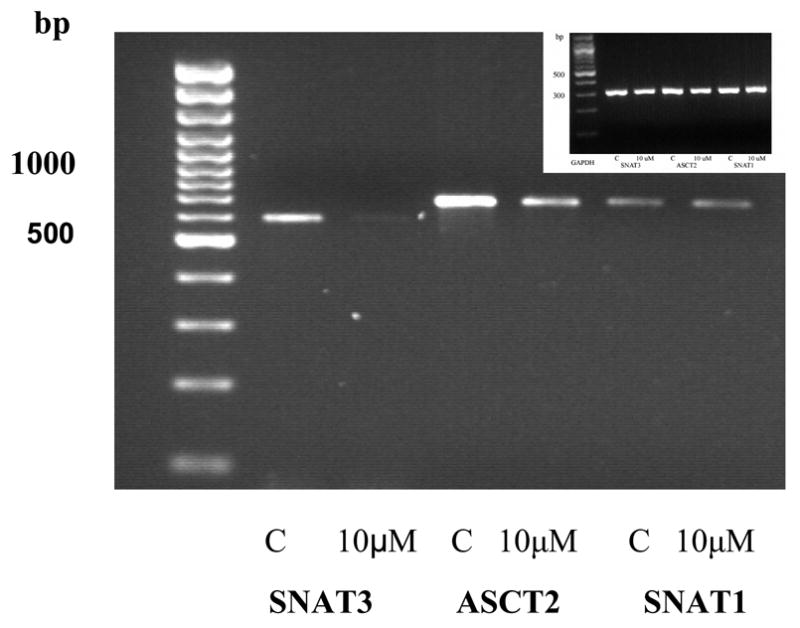
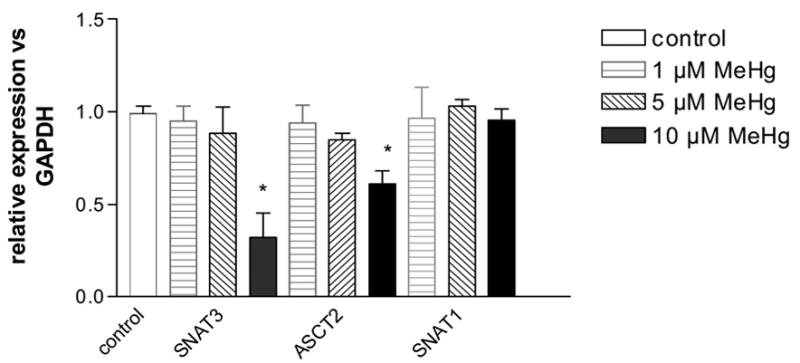
The neurotoxicity of high levels of methylmercury (MeHg) is well established both in humans and experimental animals. Astrocytes accumulate MeHg and play a prominent role in mediating MeHg toxicity in the central nervous system (CNS). Although the precise mechanisms of MeHg neurotoxicity are ill-defined, oxidative stress and altered mitochondrial and cell membrane permeability appear to be critical factors in its pathogenesis. The present study examined the effects of MeHg treatment on oxidative injury, mitochondrial inner membrane potential, glutamine uptake and expression of glutamine transporters in primary astrocyte cultures. MeHg caused a significant increase in F(2)-isoprostanes (F(2)-IsoPs), lipid peroxidation biomarkers of oxidative damage, in astrocyte cultures treated with 5 or 10 microM MeHg for 1 or 6 h. Consistent with this observation, MeHg induced a concentration-dependant reduction in the inner mitochondrial membrane potential (DeltaPsi(m)), as assessed by the potentiometric dye, tetramethylrhodamine ethyl ester (TMRE). Our results demonstrate that DeltaPsi(m) is a very sensitive endpoint for MeHg toxicity, since significant reductions were observed after only 1 h exposure to concentrations of MeHg as low as 1 microM. MeHg pretreatment (1, 5 and 10 microM) for 30 min also inhibited the net uptake of glutamine ((3)H-glutamine) measured at 1 min and 5 min. Expression of the mRNA coding the glutamine transporters, SNAT3/SN1 and ASCT2, was inhibited only at the highest (10 microM) MeHg concentration, suggesting that the reduction in glutamine uptake observed after 30 min treatment with lower concentrations of MeHg (1 and 5 microM) was not due to inhibition of transcription. Taken together, these studies demonstrate that MeHg exposure is associated with increased mitochondrial membrane permeability, alterations in glutamine/glutamate cycling, increased ROS formation and consequent oxidative injury. Ultimately, MeHg initiates multiple additive or synergistic disruptive mechanisms that lead to cellular dysfunction and cell death.
Figures
Similar articles
-
Methylmercury-induced alterations in astrocyte functions are attenuated by ebselen.Neurotoxicology. 2011 Jun;32(3):291-9. doi: 10.1016/j.neuro.2011.01.004. Epub 2011 Feb 15. Neurotoxicology. 2011. PMID: 21300091 Free PMC article.
-
Manganese induces oxidative impairment in cultured rat astrocytes.Toxicol Sci. 2007 Jul;98(1):198-205. doi: 10.1093/toxsci/kfm095. Epub 2007 Apr 27. Toxicol Sci. 2007. PMID: 17468184
-
Modulatory effect of glutathione status and antioxidants on methylmercury-induced free radical formation in primary cultures of cerebral astrocytes.Brain Res Mol Brain Res. 2005 Jun 13;137(1-2):11-22. doi: 10.1016/j.molbrainres.2005.02.006. Epub 2005 Mar 17. Brain Res Mol Brain Res. 2005. PMID: 15950756
-
Involvement of glutamate and reactive oxygen species in methylmercury neurotoxicity.Braz J Med Biol Res. 2007 Mar;40(3):285-91. doi: 10.1590/s0100-879x2007000300001. Braz J Med Biol Res. 2007. PMID: 17334523 Review.
-
Identification and characterization of uptake systems for cystine and cysteine in cultured astrocytes and neurons: evidence for methylmercury-targeted disruption of astrocyte transport.J Neurosci Res. 2001 Dec 1;66(5):998-1002. doi: 10.1002/jnr.10066. J Neurosci Res. 2001. PMID: 11746429 Review.
Cited by
-
Memantine, a Low-Affinity NMDA Receptor Antagonist, Protects against Methylmercury-Induced Cytotoxicity of Rat Primary Cultured Cortical Neurons, Involvement of Ca2+ Dyshomeostasis Antagonism, and Indirect Antioxidation Effects.Mol Neurobiol. 2017 Sep;54(7):5034-5050. doi: 10.1007/s12035-016-0020-2. Epub 2016 Aug 18. Mol Neurobiol. 2017. PMID: 27538940
-
Neuroprotective activation of astrocytes by methylmercury exposure in the inferior colliculus.Sci Rep. 2019 Sep 25;9(1):13899. doi: 10.1038/s41598-019-50377-9. Sci Rep. 2019. PMID: 31554907 Free PMC article.
-
Effect of thimerosal on thyroid hormones metabolism in rats.Endocr Connect. 2017 Nov;6(8):741-747. doi: 10.1530/EC-17-0220. Endocr Connect. 2017. PMID: 29101249 Free PMC article.
-
Comparison of alterations in amino acids content in cultured astrocytes or neurons exposed to methylmercury separately or in co-culture.Neurochem Int. 2009 Jul-Aug;55(1-3):136-42. doi: 10.1016/j.neuint.2009.01.015. Epub 2009 Jan 31. Neurochem Int. 2009. PMID: 19428818 Free PMC article.
-
Comparative toxicogenomic responses of mercuric and methyl-mercury.BMC Genomics. 2013 Oct 11;14:698. doi: 10.1186/1471-2164-14-698. BMC Genomics. 2013. PMID: 24118919 Free PMC article.
References
-
- Ali SF, LeBel CP, Bondy SC. Reactive oxygen species formation as a biomarker of methylmercury and trimethyltin neurotoxicity. Neurotoxocology. 1992;13:637 – 648. - PubMed
-
- Allen JW, El-Oqayli H, Aschner M, Syversen T, Sonnewald U. Methylmercury has a selective effect on mitochondria in cultured astrocytes in the presence of [U-13C]glutamate. Brain Res. 2001;908:149 –154. - PubMed
-
- Aschner M, Du YL, Gannon M, Kimelberg HK. Methylmercury-induced alterations in excitatory amino acid transport in rat primary astrocyte cultures. Brain Res. 1993;602:181 – 186. - PubMed
-
- Aschner M, Mullaney KJ, Wagoner D, Lash LH, Kimelberg HK. Intracellular glutathione (GSH) levels modulate mercuric chloride (MC)- and methylmercuric chloride (MeHgCl)-induced amino acid release from neonatal rat primary astrocyte cultures. Brain Res. 1994;664:133 – 140. - PubMed
-
- Aschner M. Astrocytes as modulators of mercury-induced neurotoxicity. Neurotoxicology. 1996;17:663 – 669. - PubMed
Publication types
MeSH terms
Substances
Grants and funding
LinkOut - more resources
Full Text Sources
