Comparative Study
. 2007 Mar;81(6):2545-53.
doi: 10.1128/JVI.02021-06. Epub 2006 Dec 20.

Liver-infiltrating lymphocytes in chronic human hepatitis C virus infection display an exhausted phenotype with high levels of PD-1 and low levels of CD127 expression

Affiliations
Comparative Study

Liver-infiltrating lymphocytes in chronic human hepatitis C virus infection display an exhausted phenotype with high levels of PD-1 and low levels of CD127 expression

Henry Radziewicz et al. J Virol. 2007 Mar.

Abstract

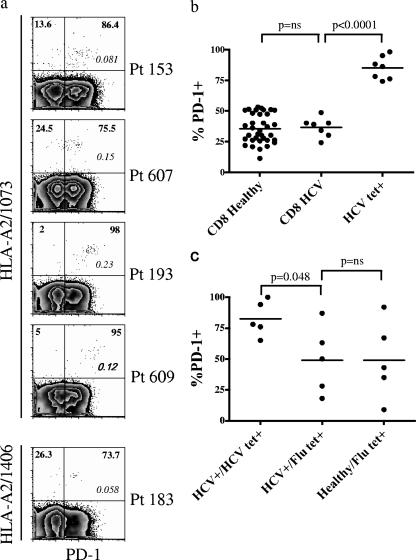
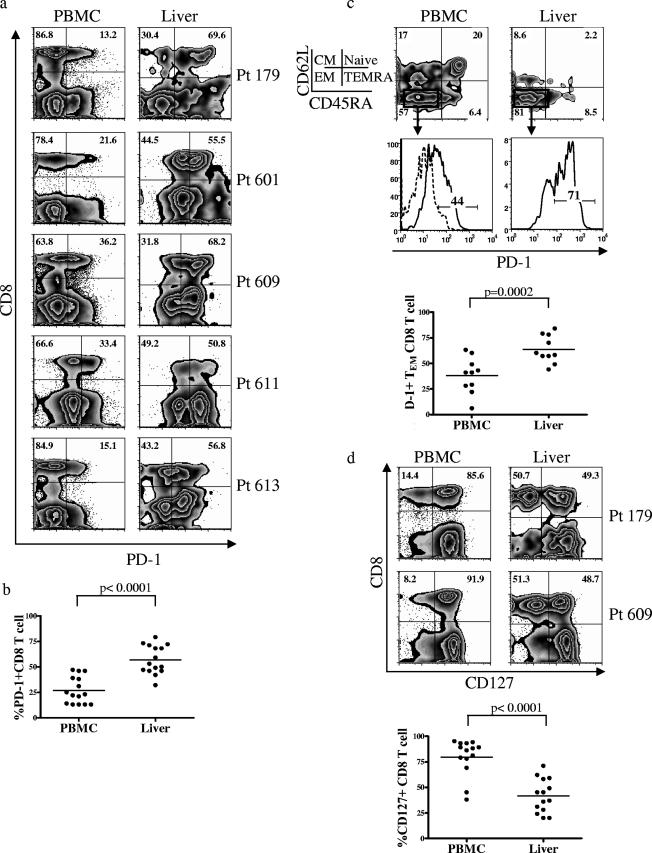
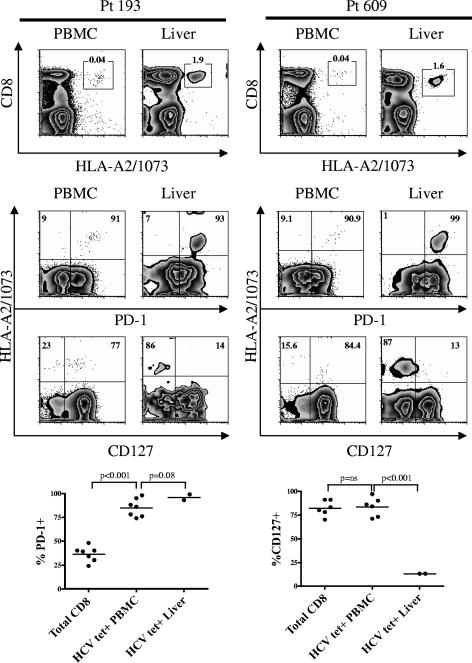
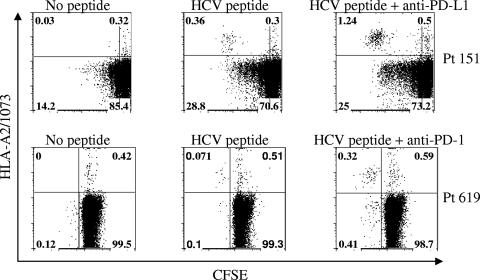
The majority of people infected with hepatitis C virus (HCV) fail to generate or maintain a T-cell response effective for viral clearance. Evidence from murine chronic viral infections shows that expression of the coinhibitory molecule PD-1 predicts CD8+ antiviral T-cell exhaustion and may contribute to inadequate pathogen control. To investigate whether human CD8+ T cells express PD-1 and demonstrate a dysfunctional phenotype during chronic HCV infection, peripheral and intrahepatic HCV-specific CD8+ T cells were examined. We found that in chronic HCV infection, peripheral HCV-specific T cells express high levels of PD-1 and that blockade of the PD-1/PD-L1 interaction led to an enhanced proliferative capacity. Importantly, intrahepatic HCV-specific T cells, in contrast to those in the periphery, express not only high levels of PD-1 but also decreased interleukin-7 receptor alpha (CD127), an exhausted phenotype that was HCV antigen specific and compartmentalized to the liver, the site of viral replication.


Figures

FIG. 1.
FIG. 1.
HCV specific CD8+ T cells express PD-1 in human chronic HCV infection. (a) Representative plots from five patients with chronic HCV infection, showing the expression of PD-1 on HCV-specific CD8+ T cells. Numbers in boldface identify the frequency of PD-1 expression (x axis) on HCV-specific CD8+ T cells (y axis). Numbers in italic within the plots identify the frequency of tetramer-positive cells among total CD8+ T cells. On the y axis, 1073 and 1406 identify the HCV epitope specificity of the tetramer. Patients are identified by “Pt” followed by the patient number. Cells were gated on CD8+ lymphocytes. Plots are on a logarithmic scale. (b) Comparison of PD-1 expression on CD8+ T cells from healthy donors (CD8 Healthy) and from HCV-infected patients (CD8 HCV) and on CD8+ HCV-specific T cells (HCV tet+). (c) PD-1 expression on CD8+ T cells specific for influenza virus (Flu tet+) from HCV-infected patients (HCV+) and healthy donors (Healthy) compared with PD-1 expression on CD8+ T cells specific for HCV (HCV tet+). A paired t test was used to compare differences in expression of PD-1 within the same patient on total CD8+ T cells versus HCV-specific CD8+ T cells.
FIG. 2.
FIG. 2.
The frequency of PD-1-expressing CD8+ T cells in the liver is greater than in the peripheral blood. (a) Representative plots from five patients with chronic HCV infection, showing the expression of PD-1 on total CD8+ T cells from the peripheral blood versus the liver. Numbers in boldface within the plots identify the frequency of cells with PD-1 expression among total CD8+ T cells in the lymphocyte gate. Plots are on a logarithmic scale. (b) Comparison of PD-1 expression on CD8+ T cells from peripheral blood versus liver in chronically HCV-infected patients. A paired t test was used to compare the difference in PD-1 expression within the same patients. (c) Comparison of PD-1 expression on the CD8+ effector memory (TEM) cells from peripheral blood versus liver. Memory subsets were identified by differential expression of CD62L and CD45RA. Boldface numbers in the top plots represent the frequency of cells in each quadrant. Cells were gated on CD8+ lymphocytes. The TEM subset was gated (boxes), and the expression of PD-1 is shown in the histogram plots below. The dotted line shows PD-1 expression on naïve CD8+ T cells (used as the negative population). The numbers in the histogram plots represent the frequency of cells expressing PD-1. A comparison of the frequency of PD-1 expression on CD8+ TEM cells for 10 patients with chronic HCV infection is summarized below the histogram plots. A paired t test was used to compare the difference in PD-1 expression on CD8+ TEM cells from the peripheral blood versus the liver within the same patient. (d) Representative plots from two patients with chronic HCV infection, showing the difference in CD127 expression on total CD8+ T cells from the peripheral blood versus the liver. Numbers in boldface identify the frequency of CD127 expression on total CD8+ T cells. Cells were gated on CD8+ lymphocytes. Plots are on a logarithmic scale. A summary of the comparison of CD127 expression on total CD8+ T cells in the peripheral blood versus the liver is shown below the FACS plots. A paired t test was used for statistical analysis.
FIG. 3.
FIG. 3.
HCV-specific CD8+ T cells in the liver express an exhausted phenotype. Representative plots of PD-1 and CD127 expression on HCV-specific CD8+ T cells from the peripheral blood and the liver of two patients with chronic HCV infection are shown. The first row of plots identifies the HCV tetramer-positive population (boxes). The numbers above the boxes represent the frequency of tetramer-positive cells among CD3+ lymphocytes. The epitope specificity of the HCV tetramer is identified on the x axis (1073) for the first row of plots. The second and third rows of plots show PD-1 and CD127 expression on HCV-specific CD8+ T cells from the peripheral blood and liver of two patients with chronic HCV infection. Numbers in boldface represent the frequency of PD-1 or CD127 expression on HCV-specific CD8+ T cells. Plots are on a logarithmic scale and gated on CD3+ CD8+ lymphocytes. Below the FACS plots, a summary of the comparison of PD-1 expression (left) and CD127 expression (right) on total CD8+ T cells versus CD8+ HCV-specific T cells from the periphery (HCV tet+ PBMC) versus HCV specific CD8+ T cells from the liver (HCV tet+ Liver) is shown. Paired t tests were used to compare expression within the same patient.
FIG. 4.
FIG. 4.
Blockade of the PD-1/PD-L1 pathway increases the expansion of antigen-stimulated HCV-specific T cells. CFSE-labeled PBMCs from two separate HLA-A2-positive patients were stimulated using the cognate peptide antigen for 6 days in the presence of IL-2 and anti-PD-L1 antibody (top panel) or anti-PD-1 antibody (lower panel). Results for an unstimulated control are also shown. The percentages of proliferating CFSE low- and CFSE high-HCV-specific HLA-A2+ CD8+ T cells are shown in each quadrant.

Comment in

Similar articles

Cited by

References

    1. Alter, M. J., D. Kruszon-Moran, O. V. Nainan, G. M. McQuillan, F. Gao, L. A. Moyer, R. A. Kaslow, and H. S. Margolis. 1999. The prevalence of hepatitis C virus infection in the United States, 1988 through 1994. N. Engl. J. Med. 341:556-562. - PubMed
    1. Alter, M. J., H. S. Margolis, K. Krawczynski, F. N. Judson, A. Mares, W. J. Alexander, P. Y. Hu, J. K. Miller, M. A. Gerber, R. E. Sampliner, et al. 1992. The natural history of community-acquired hepatitis C in the United States. N. Engl. J. Med. 327:1899-1905. - PubMed
    1. Appay, V., P. R. Dunbar, M. Callan, P. Klenerman, G. M. Gillespie, L. Papagno, G. S. Ogg, A. King, F. Lechner, C. A. Spina, S. Little, D. V. Havlir, D. D. Richman, N. Gruener, G. Pape, A. Waters, P. Easterbrook, M. Salio, V. Cerundolo, A. J. McMichael, and S. L. Rowland-Jones. 2002. Memory CD8+ T cells vary in differentiation phenotype in different persistent virus infections. Nat. Med. 8:379-385. - PubMed
    1. Bachmann, M. F., P. Wolint, K. Schwarz, P. Jager, and A. Oxenius. 2005. Functional properties and lineage relationship of CD8+ T cell subsets identified by expression of IL-7 receptor alpha and CD62L. J. Immunol. 175:4686-4696. - PubMed
    1. Barber, D. L., E. J. Wherry, D. Masopust, B. Zhu, J. P. Allison, A. H. Sharpe, G. J. Freeman, and R. Ahmed. 2006. Restoring function in exhausted CD8 T cells during chronic viral infection. Nature 439:682-687. - PubMed

Publication types

Substances