. 2007 Mar;81(5):2440-8.
doi: 10.1128/JVI.01847-06. Epub 2006 Dec 20.

CD8 T-cell recognition of multiple epitopes within specific Gag regions is associated with maintenance of a low steady-state viremia in human immunodeficiency virus type 1-seropositive patients

Affiliations

CD8 T-cell recognition of multiple epitopes within specific Gag regions is associated with maintenance of a low steady-state viremia in human immunodeficiency virus type 1-seropositive patients

Christof Geldmacher et al. J Virol. 2007 Mar.

Abstract

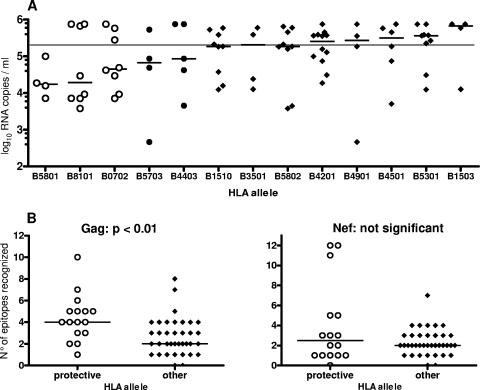
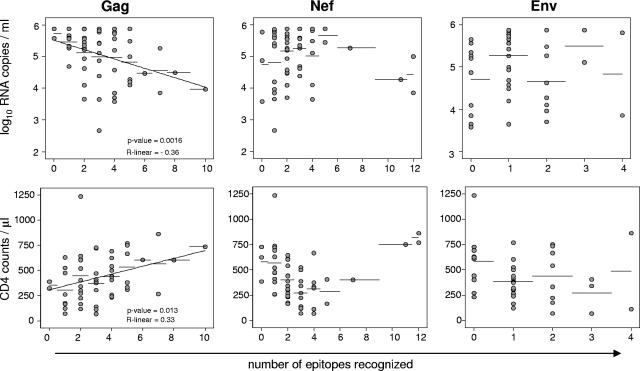
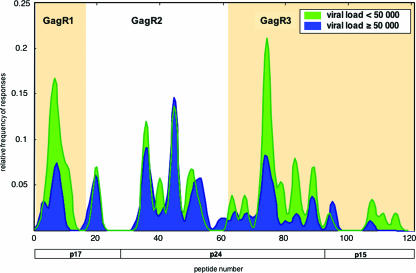
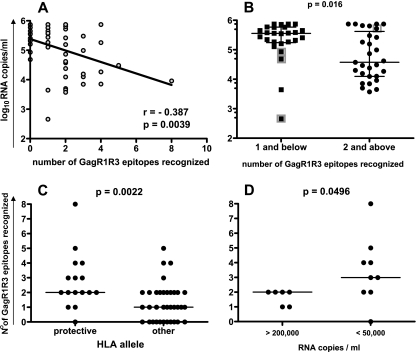
The importance of HLA class I-restricted CD8 T-cell responses in the control of human immunodeficiency virus (HIV) infection is generally accepted. While several studies have shown an association of certain HLA class I alleles with slower disease progression, it is not fully established whether this effect is mediated by HIV-specific CD8 T-cell responses restricted by these alleles. In order to study the influence of the HLA class I alleles on the HIV-specific CD8 T-cell response and on viral control, we have assessed HIV-specific epitope recognition, plasma viral load, and expression of HLA class I alleles in a cohort of HIV-seropositive bar workers. Possession of the HLA class I alleles B5801, B8101, and B0702 was associated with a low median viral load and simultaneously with a broader median recognition of Gag epitopes compared to all other HLA alleles (twofold increase) (P = 0.0035). We further found an inverse linear relationship between the number of Gag epitopes recognized and the plasma viral load (R = -0.36; P = 0.0016). Particularly, recognition of multiple epitopes within two regions of Gag (amino acids [aa] 1 to 75 and aa 248 to 500) was associated with the maintenance of a low steady-state viremia, even years after acute infection.


Figures

FIG. 1.
FIG. 1.
Expression of “protective” HLA class I B alleles correlates with a broad Gag-specific CD8 T-cell response. HLA class I expression and plasma viral load in chronically infected study subjects (n = 54) are shown in panel A. The line indicates the median viral load of the HISIS-CTL cohort (198,500 viral RNA copies/ml). (B) Shown is the number of recognized epitopes for Gag and Nef from study subjects who express either HLA-B alleles B0702, B8101, or B5801 (n = 16) (open circles) or other HLA-B alleles (n = 37) (closed circles). Gag peptide responses were determined with an IFN-γ ELISPOT assay. Recognition of two consecutive peptides was counted as one epitope response. The Mann-Whitney test was used to analyze the breadth of the Gag- and Nef-specific T-cell responses associated with these alleles.
FIG. 2.
FIG. 2.
Linear relationship between viral load and CD4 counts with the number of recognized epitopes within Gag but not within Nef or Env. Shown are (A) the linear regression analysis of the viral load and (B) the CD4 count versus the number of epitopes recognized per subject for Gag (left panels), Nef (middle panels), and Env (right panels). Recognition of two consecutive peptides was counted as on epitope response. Statistical analysis was performed using the Spearman rank test.
FIG. 3.
FIG. 3.
Gag-specific CD8 T-cell epitope recognition of subjects with a plasma viral load below (n = 19) or above (n = 36) 50,000 RNA copies/ml. Shown is the magnitude of responses after smooth local average with Gaussian kernel weights and a standard deviation (bandwidth) of 1 peptide.
FIG. 4.
FIG. 4.
Relationship of the recognition of multiple epitopes within Gag regions at aa 1 to 075 and aa 248 to 500 (GagR1R3) with efficient viral control and protective HLA class I B alleles. Shown are (A) the linear regression analysis of the viral load and the number of GagR1R3 epitopes recognized and (B) the viral loads of subjects with a broad (n = 29) or narrow (n = 26) CD8 T-cell response against GagR1R3. The cutoff value was 2 epitopes recognized. The respective median is indicated. HLA B5703-expressing subjects are indicated as gray squares. (C) The numbers of recognized epitopes for GagR1R3 from study subjects who express HLA-B alleles B0702, B8101, or B5801 (n = 16) (“protective”) and from those expressing other HLA-B alleles (n = 37,other) and within these subjects (D) show a comparison of the number of recognized GagR1R3 epitopes of subjects with a high viral load above 200,000 RNA copies/ml (n = 6) and those with a viral load below 50,000 RNA copies/ml (n = 9). Statistical analysis for B, C, and D was performed using the Mann-Whitney test (two tailed).
FIG. 5.
FIG. 5.
Variability of important immunodominant Gag epitopes. Shown is the Shannon entropy score (y axis) for each amino acid position of the epitopes (A) RL10 (aa 22 to 31), (B) HW9 (aa 28 to 36), (C) TL9 (aa 180 to 188), and (D) GM9 (aa 338 to 346). The entropy at amino acid anchor residues is indicated as striped bars. The epitope sequence included in the best recognized peptide variant is shown on the x axis. The entropy score analysis is based on HIV-1 Gag sequences of primary isolates from the Mbeyan Region (n = 41).
FIG. 6.
FIG. 6.
Dynamics of the plasma viral load after seroconversion. Shown is the viral load since seroconversion of study subjects who (A) recognized two or more epitopes (n = 12) or (B) zero or one epitope (n = 7) within the Gag regions at aa 1 to 75 and aa 297 to 500. The median viral load is indicated in red. Gag peptide responses were determined between 15 and 39 months (follow-up 14) after seroconversion with an IFN-γ ELISPOT assay. Three HLA-B5703-expressing subjects were excluded from the analysis. Recognition of two consecutive peptides was counted as one epitope response. vRNA, viral RNA.

References

    1. Addo, M. M., X. G. Yu, A. Rathod, D. Cohen, R. L. Eldridge, D. Strick, et al. 2003. Comprehensive epitope analysis of human immunodeficiency virus type 1 (HIV-1)-specific T-cell responses directed against the entire expressed HIV-1 genome demonstrate broadly directed responses but no correlation to viral load. J. Virol. 77:2081-2092. - PMC - PubMed
    1. Altfeld, M., M. M. Addo, E. S. Rosenberg, F. M. Hecht, P. K. Lee, M. Vogel, et al. 2003. Influence of HLA-B57 on clinical presentation and viral control during acute HIV-1 infection. AIDS 17:2581-2591. - PubMed
    1. Appay, V., D. F. Nixon, S. M. Donahoe, G. M. Gillespie, T. Dong, A. King, et al. 2000. HIV-specific CD8(+) T cells produce antiviral cytokines but are impaired in cytolytic function. J. Exp. Med. 192:63-75. - PMC - PubMed
    1. Betts, M. R., D. R. Ambrozak, D. C. Douek, S. Bonhoeffer, J. M. Brenchley, J. P. Casazza, R. A. Koup, and L. J. Picker. 2001. Analysis of total human immunodeficiency virus (HIV)-specific CD4+ and CD8+ T-cell responses: relationship to viral load in untreated HIV infection. J. Virol. 75:11983-11991. - PMC - PubMed
    1. Borrow, P., H. Lewicki, B. H. Hahn, G. M. Shaw, and M. B. Oldstone. 1994. Virus-specific CD8+ cytotoxic T-lymphocyte activity associated with control of viremia in primary human immunodeficiency virus type 1 infection. J. Virol. 68:6103-6110. - PMC - PubMed

Publication types