Comparative Study
. 2006 Dec 20;26(51):13250-63.
doi: 10.1523/JNEUROSCI.1991-06.2006.

Local edge detectors: a substrate for fine spatial vision at low temporal frequencies in rabbit retina

Affiliations
Comparative Study

Local edge detectors: a substrate for fine spatial vision at low temporal frequencies in rabbit retina

Michiel van Wyk et al. J Neurosci. .

Abstract

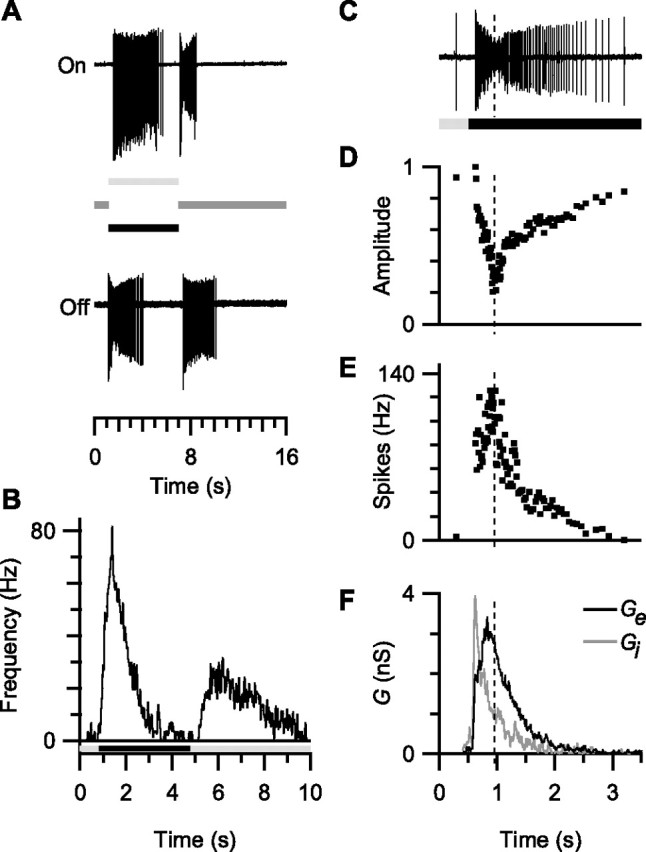
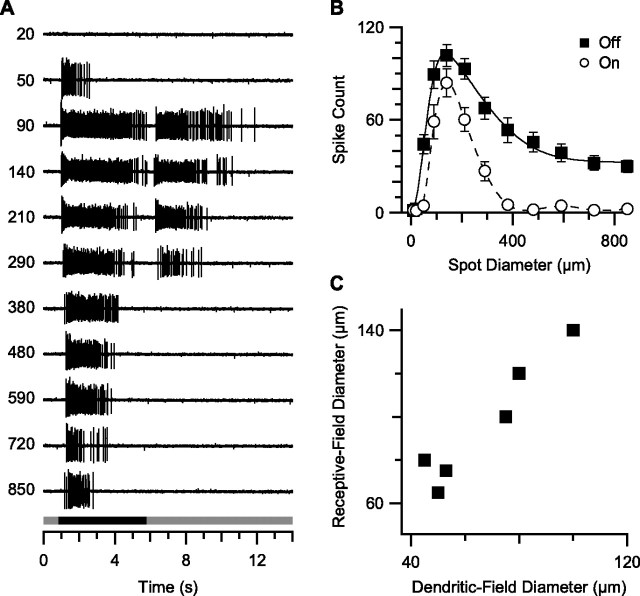
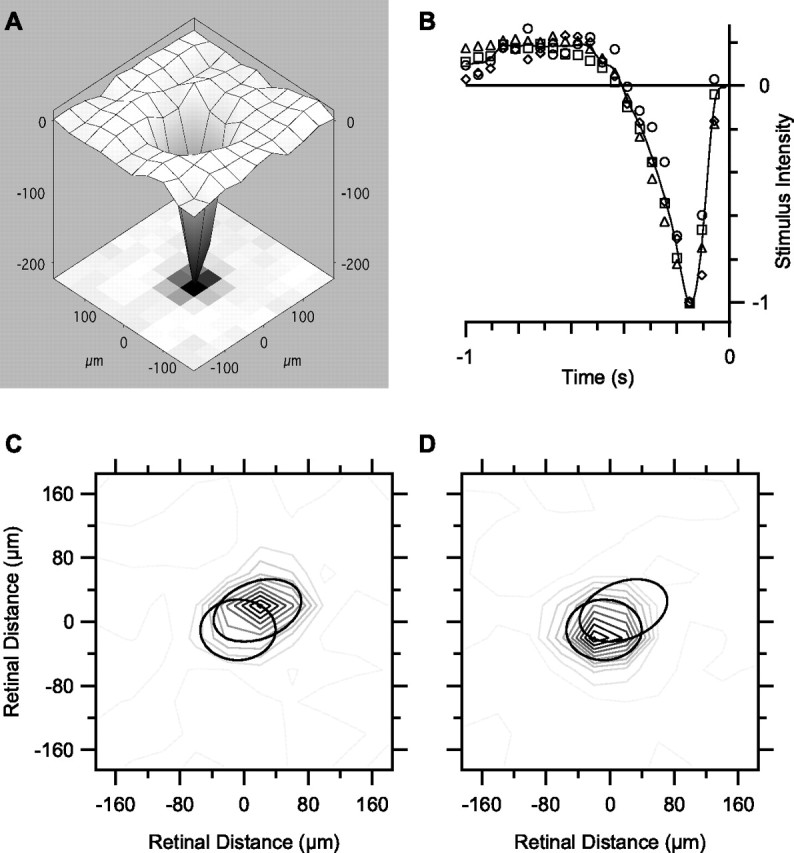
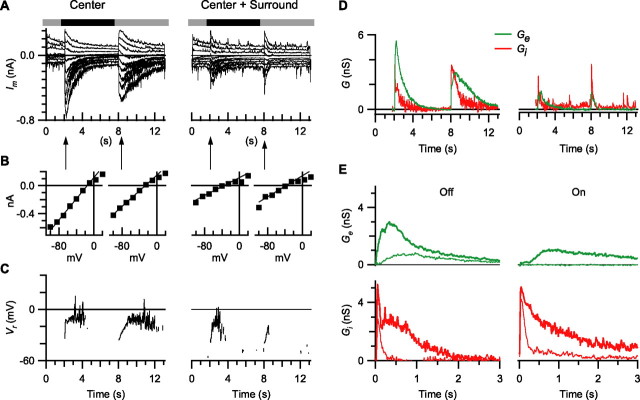
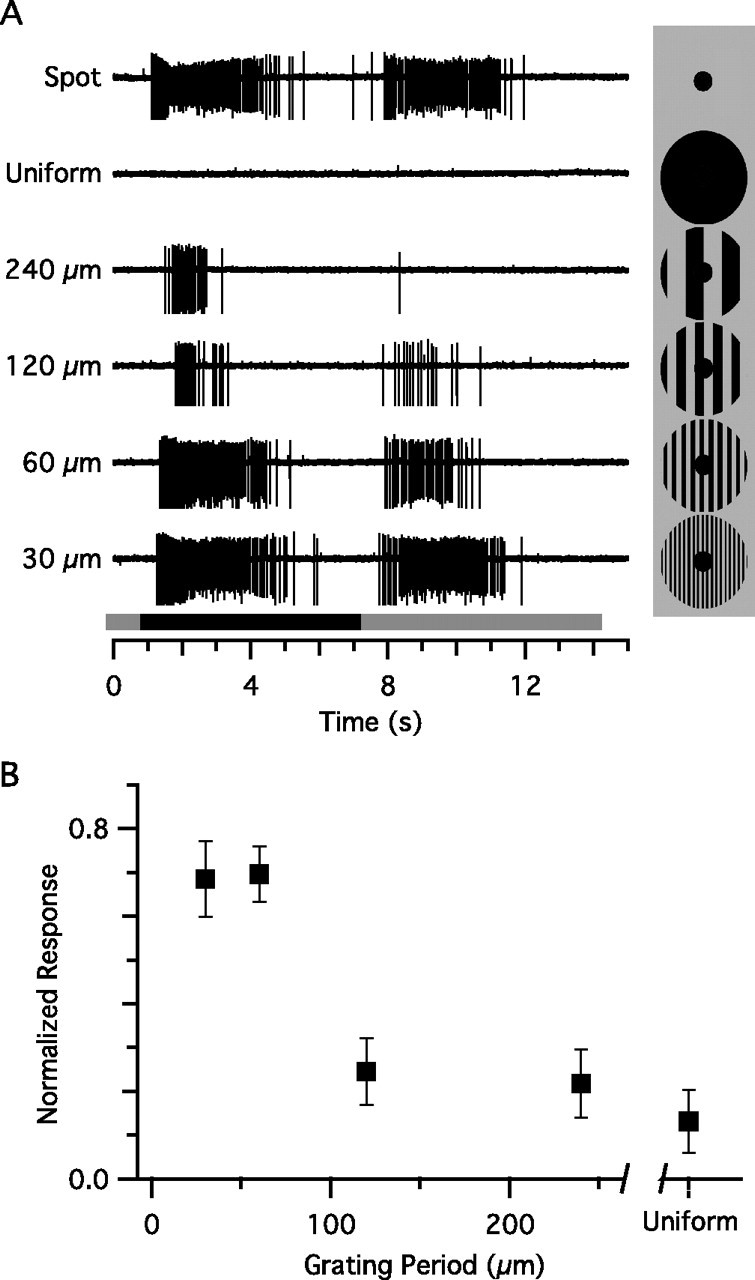
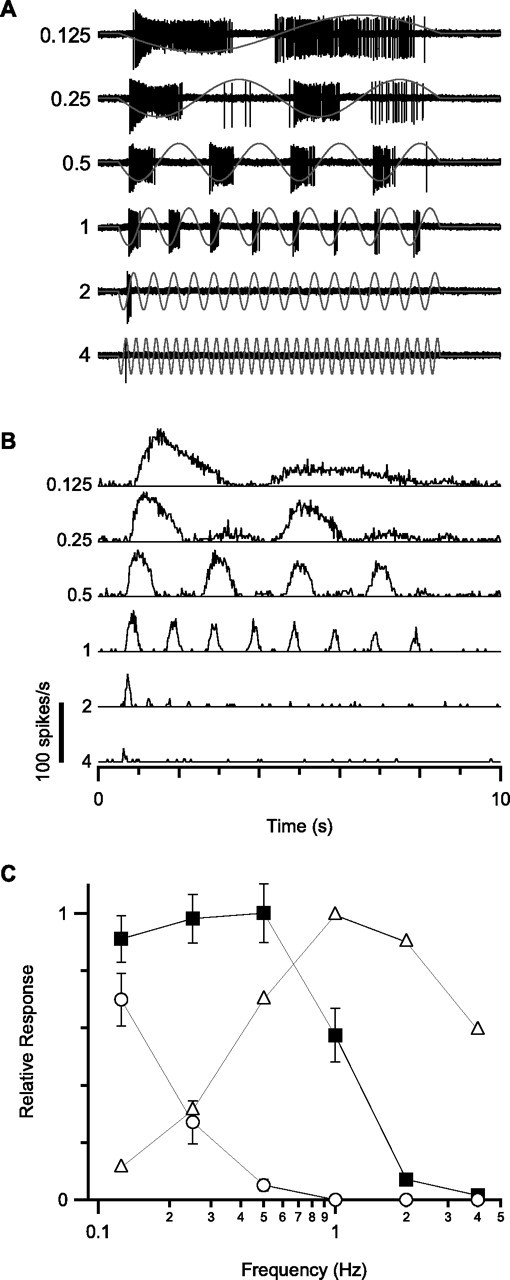
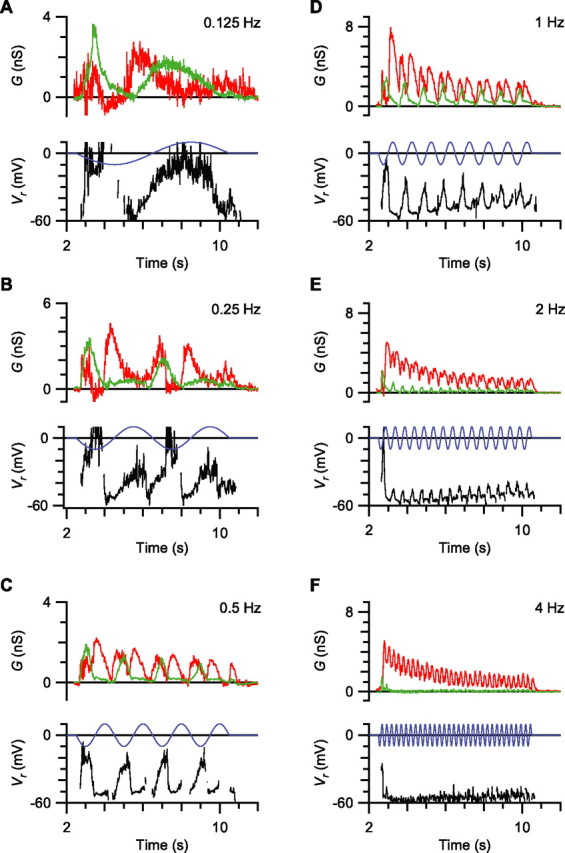
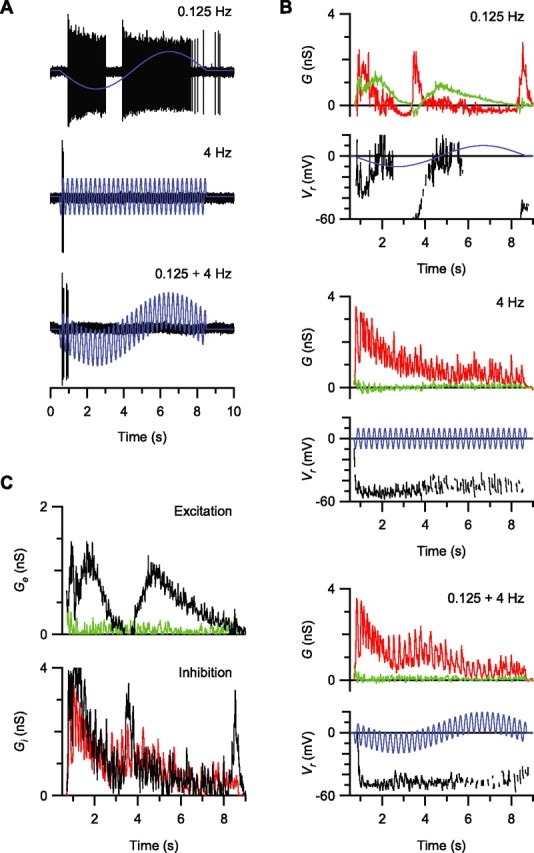
Visual acuity is limited by the size and density of the smallest retinal ganglion cells, which correspond to the midget ganglion cells in primate retina and the beta-ganglion cells in cat retina, both of which have concentric receptive fields that respond at either light-On or light-Off. In contrast, the smallest ganglion cells in the rabbit retina are the local edge detectors (LEDs), which respond to spot illumination at both light-On and light-Off. However, the LEDs do not predominate in the rabbit retina and the question arises, what role do they play in fine spatial vision? We studied the morphology and physiology of LEDs in the isolated rabbit retina and examined how their response properties are shaped by the excitatory and inhibitory inputs. Although the LEDs comprise only approximately 15% of the ganglion cells, neighboring LEDs are separated by 30-40 microm on the visual streak, which is sufficient to account for the grating acuity of the rabbit. The spatial and temporal receptive-field properties of LEDs are generated by distinct inhibitory mechanisms. The strong inhibitory surround acts presynaptically to suppress both the excitation and the inhibition elicited by center stimulation. The temporal properties, characterized by sluggish onset, sustained firing, and low bandwidth, are mediated by the temporal properties of the bipolar cells and by postsynaptic interactions between the excitatory and inhibitory inputs. We propose that the LEDs signal fine spatial detail during visual fixation, when high temporal frequencies are minimal.


Figures

Figure 1.
Figure 1.
Microscopic identification of LED somata. Shown is a fluorescence micrograph of a piece of rabbit retina labeled with acridine orange, with the focus on the ganglion cell layer; this field was located 1 mm ventral to the visual streak. Presumptive LEDs (circles) can be identified by the size and shape of the soma and nucleus.
Figure 2.
Figure 2.
Dendritic morphology and stratification of LEDs. A, Through-projection of an Alexa 488-injected LED reconstructed from 29 confocal micrographs. B, Side projection of the same cell. C, Through-projection of an Alexa 568-injected LED with an overlapping Alexa 488-injected On–Off direction-selective ganglion cell. D, Side projection of the same cells; the monostratified dendrites of the LED are sandwiched between the bistratified dendrites of the direction-selective cell. The vertical dimension in B and D has been stretched for illustration purposes.
Figure 3.
Figure 3.
Retinal topography of LEDs. A, Dendritic-field size of Neurobiotin-injected cells increased as the ganglion cell density declined with retinal eccentricity from the visual streak; the circles mark one cell near the streak and another in the far periphery whose dendritic morphology is shown in the inset drawings, scaled relative to the vertical axis of the graph. B, Confocal reconstruction of three adjacent LEDs injected with Alexa Fluor dyes (green, Alexa 488; red, Alexa 568; yellow, Alexa 488 and Alexa 568) shows that they overlap substantially, with the dendrites of each cell reaching almost as far as the soma of the neighbors.
Figure 4.
Figure 4.
Tracer-coupling pattern of LEDs. A, Confocal reconstruction of a Neurobiotin-injected LED reacted with Alexa 488–streptavidin shows that the LED is tracer-coupled to four overlapping amacrine cells, three of which have wide-field unistratified dendritic trees (asterisks). B, Confocal reconstruction of a Neurobiotin-injected LED (green) and the corresponding field of GABA-immunoreactive amacrine cells (red); five tracer-coupled somata that are weakly GABA-immunopositive are located within and external to the LED dendritic field (squares), whereas a single tracer-coupled soma that is GABA-immunonegative is located within the dendritic field (circle). C, Confocal reconstruction of a Neurobiotin-injected LED (green) and the corresponding field of glycine-immunoreactive amacrine cells; three tracer-coupled somata that are strongly glycine-immunopositive are located within the LED dendritic field (circles), whereas three tracer-coupled somata that are glycine-immunonegative are located within and external to the dendritic field (squares).
Figure 5.
Figure 5.
On–Off responses of LEDs. A, When a bright or dark spot of 100 μm diameter was presented for 6 s, LEDs produced sustained firing for several seconds at both the initiation and termination of the stimulus. B, Spike-time histogram for stimulation by a dark spot, accumulated from six LEDs; the ordinate shows equivalent spike-rate per trial for 10 ms bins. C, Spike responses recorded at the initiation of a dark-spot stimulus. D, The relative amplitude of the extracellular spikes was strongly attenuated ∼0.5 s after stimulus initiation. E, Peak attenuation of the spike amplitude coincided with the maximum spike rate during the response. F, Synaptic conductances observed in the same cell during the light stimulus.
Figure 6.
Figure 6.
Spatial response properties of LEDs. A, Spike responses of an LED to dark spots of increasing diameter (size in micrometers) presented for 5 s (black bar). Off responses were elicited by a broad range of spot sizes, whereas On responses appeared only when spots had a similar size to the receptive-field center. B, Area–response function for 10 LEDs, showing the mean spike count (±SEM) for dark spots of increasing diameter. The smooth curve through the Off-response data (black squares) shows the best-fitting DOG function (see Materials and Methods); parameters were as follows: Ac = 121 ± 6 spikes, σc = 72 ± 4 μm, As = 88 ± 5 spikes, and σs = 321 ± 21 μm. The dashed curve through the On response data (white circles) shows a smooth interpolation of the data points. C, Comparison of receptive-field and dendritic-field diameters for six Neurobiotin-injected LEDs; the receptive-field diameters were determined from fits to DOG functions, as shown in B.
Figure 7.
Figure 7.
Receptive-field overlap determined from a spatiotemporal white-noise stimulus. A, Spike-triggered average stimulus for one LED obtained 150 ms before the spike; stimulus pixel size was 40 μm, display rate was 21.2 Hz. B, Time course for four LEDs (different symbols) of the intensity of the central pixels from the spike-triggered average stimulus, normalized to the response amplitude at −150 ms; the smooth curve shows a cubic interpolation. C, D, Contour plots of the peak spike-triggered average stimulus in two adjacent LEDs, which were recorded simultaneously, showing the extent of receptive-field overlap; the contour plots for each cell are plotted separately for clarity. The smooth ellipses show the 1 SD contour of the best-fitting Gaussian surface for both the plotted cell and the adjacent cell: the 1 SD contour of each LED reaches the center of the adjacent cell.
Figure 8.
Figure 8.
Synaptic mechanisms generating surround inhibition. A, Synaptic currents, Im, elicited by center stimulation (100 μm diameter dark spot) and center-plus-surround stimulation (850 μm diameter dark spot) at a series of holding potentials from −100 to +20 mV in 15 mV steps; the stimulus timing and contrast sign are shown by the bars above the current records. B, Examples of the IV relations measured at the time points indicated by the arrows. The regression lines through the measurements demonstrate that the synaptic conductances were linear over the expected physiological voltage range; the slope and voltage axis intercept of the regression lines were used to evaluate the synaptic conductance and synaptic reversal potential, respectively. C, Synaptic reversal potential, Vr, calculated for the currents shown in A; for clarity, the reversal potential is only displayed when the synaptic conductance exceeded 0.5 nS. D, Synaptic conductances calculated for the currents shown in A; the excitatory (Ge; green) and inhibitory (Gi; red) components were derived as described in Materials and Methods. E, Excitatory and inhibitory conductance components for center (thick lines) and center-plus-surround (thin lines) stimulation; each record is an average from four LEDs.
Figure 9.
Figure 9.
Spatial tuning of the antagonistic surround. A, Spike records obtained for the stimuli shown to the right of each record; the stimulus timing and contrast sign are shown by the bar below the spike records. The spot diameter was 100 μm and the surround diameter was 850 μm; the spatial period of the surround gratings is shown to the left of each record. B, Mean response (±SEM) of six cells to the stimuli shown in A. Responses are the combined spike counts during the On and Off responses, and are normalized to the response for the center spot alone.
Figure 10.
Figure 10.
Temporal response properties of LEDs. A, Spike responses elicited by sinusoidal flicker stimuli (gray) at the temporal frequencies (in hertz) indicated to the left of each record; the stimulus was a center spot of 100 μm diameter at ±80% contrast. B, Spike-time histograms accumulated from 10 cells; the ordinate is the spike frequency per trial (10 ms bins). C, Mean normalized response amplitude (±SEM) versus stimulus frequency for seven LEDs (black squares, Off response; white circles, On response) and one On-center brisk-sustained cell (white triangles). Response amplitude was calculated as the total number of spikes elicited during the On or Off response for an 8 s stimulus.
Figure 11.
Figure 11.
Temporal properties of excitatory and inhibitory synaptic inputs. A–F, Each of the six panels shows the synaptic conductance and reversal potentials for a different stimulus frequency (0.125–4 Hz), calculated as in Figure 8. In each case, the top panel shows the calculated excitatory conductance (green) and inhibitory conductance (red); the bottom panel shows the stimulus timing (blue) and the synaptic reversal potential (black).
Figure 12.
Figure 12.
Nonlinearities in temporal response characteristics. The sinusoidal flicker stimulus (blue) was a center spot of 100 μm diameter. A, Spike recordings (black) showing responses to 0.125 Hz (top record), 4 Hz flicker (middle record), and 0.125 + 4 Hz flicker (bottom record); the peak-to-peak stimulus contrast was ±40% for single frequencies and ±80% for the superimposed frequencies. B, The measured reversal potentials (Vr; black) and the calculated excitatory (green) and inhibitory (red) synaptic conductances are shown for each flicker stimulus. C, The black lines show the linear prediction obtained by adding together the conductance components for the 0.125 Hz stimulus and 4 Hz stimulus (B, top and middle panels); the green and red lines show the actual conductance components for the combined 0.125 + 4 Hz stimulus (B, bottom panel).

Similar articles

Cited by

References

    1. Amthor FR, Oyster CW. Spatial organization of retinal information about the direction of image motion. Proc Natl Acad Sci USA. 1995;92:4002–4005. - PMC - PubMed
    1. Amthor FR, Takahashi ES, Oyster CW. Morphologies of rabbit retinal ganglion cells with complex receptive fields. J Comp Neurol. 1989;280:97–121. - PubMed
    1. Awatramani GB, Slaughter MM. Origin of transient and sustained responses in ganglion cells of the retina. J Neurosci. 2000;20:7087–7095. - PMC - PubMed
    1. Berry MJ. Studying the population code of the retina. In: Stett A, editor. Proceedings MEA meeting 2006. Stuttgart, Germany: BIOPRO Baden-Württemberg GmbH; 2006. pp. 82–85.
    1. Berson DM, Pu M, Famiglietti EV. The zeta cell: a new ganglion cell type in cat retina. J Comp Neurol. 1998;399:269–288. - PubMed

Publication types

LinkOut - more resources