. 2007 Feb;18(2):594-604.
doi: 10.1091/mbc.e06-06-0530. Epub 2006 Dec 20.

Mitogen-activated protein kinase kinase 1-dependent Golgi unlinking occurs in G2 phase and promotes the G2/M cell cycle transition

Affiliations

Mitogen-activated protein kinase kinase 1-dependent Golgi unlinking occurs in G2 phase and promotes the G2/M cell cycle transition

Timothy N Feinstein et al. Mol Biol Cell. 2007 Feb.

Abstract

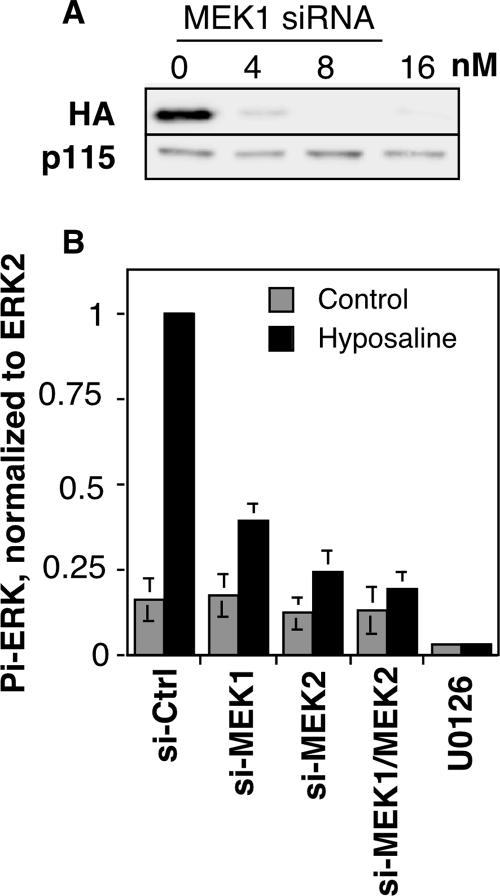
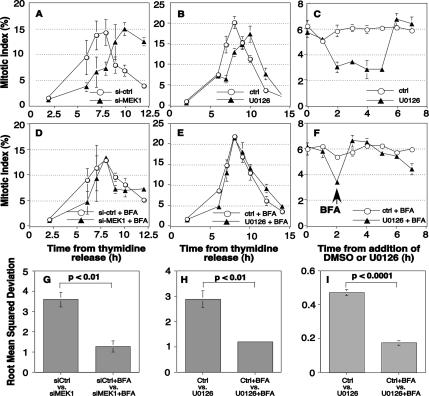
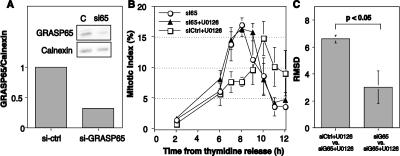
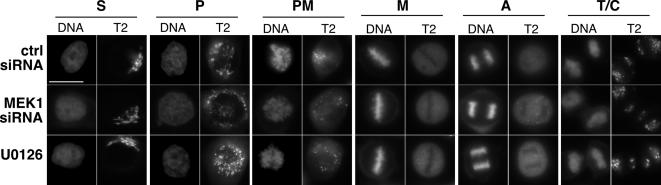
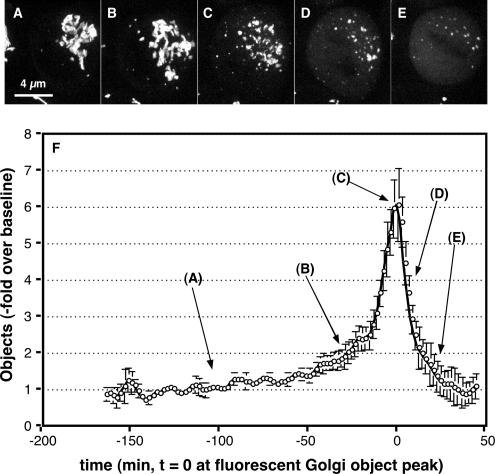
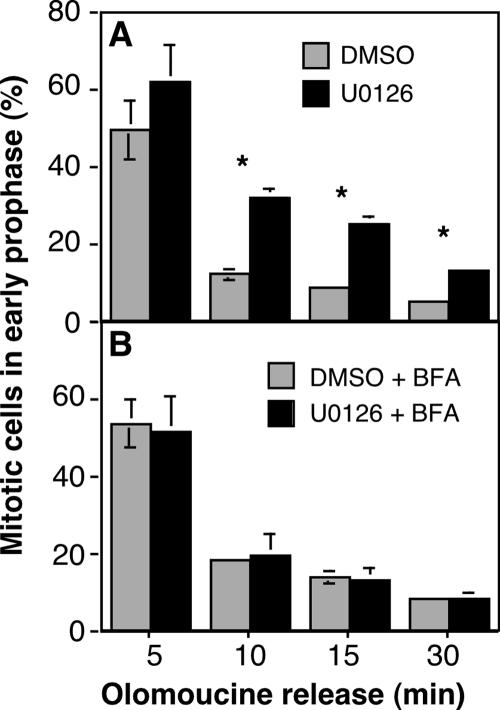
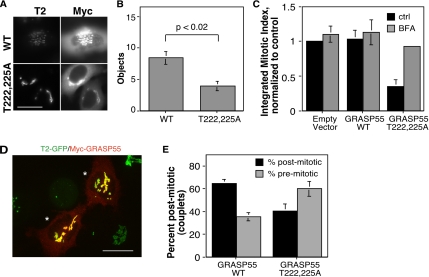
Two controversies have emerged regarding the signaling pathways that regulate Golgi disassembly at the G(2)/M cell cycle transition. The first controversy concerns the role of mitogen-activated protein kinase activator mitogen-activated protein kinase kinase (MEK)1, and the second controversy concerns the participation of Golgi structure in a novel cell cycle "checkpoint." A potential simultaneous resolution is suggested by the hypothesis that MEK1 triggers Golgi unlinking in late G(2) to control G(2)/M kinetics. Here, we show that inhibition of MEK1 by RNA interference or by using the MEK1/2-specific inhibitor U0126 delayed the passage of synchronized HeLa cells into M phase. The MEK1 requirement for normal mitotic entry was abrogated if Golgi proteins were dispersed before M phase by treatment of cells with brefeldin A or if GRASP65, which links Golgi stacks into a ribbon network, was depleted. Imaging revealed that unlinking of the Golgi apparatus begins before M phase, is independent of cyclin-dependent kinase 1 activation, and requires MEK signaling. Furthermore, expression of the GRASP family member GRASP55 after alanine substitution of its MEK1-dependent mitotic phosphorylation sites inhibited both late G(2) Golgi unlinking and the G(2)/M transition. Thus, MEK1 plays an in vivo role in Golgi reorganization, which regulates cell cycle progression.


Figures

Figure 1.
Figure 1.
Depletion of MEK1 inhibits ERK activation. (A) Extracts of HeLa cells stably expressing an HA-tagged copy of human MEK1 (40 μg/lane) were prepared 72 h after transfection with the indicated concentrations of the MEK1 siRNA and were analyzed by immunoblotting by using anti-HA to detect HA-MEK1 (top) or anti-p115 as a loading control (bottom). (B) To assay ERK activation after knockdown, HeLa cells were transfected with the indicated siRNAs, and after 72 h, the cells were placed for 5 min in either iso-osmotic buffer (control) or hypo-osmotic buffer (hyposaline). Cell extracts were then prepared and analyzed by immunoblot by using anti-phospho-ERK antibody, and, after stripping of the blot, anti-ERK2 antibody. Quantification of the phospho-ERK/ERK2 ratio is shown (mean ± SEM, n = 3). Note that knockdown, especially the combined MEK1/MEK2 knockdown, blocked stimulated, but not resting, levels of ERK phosphorylation. As a positive control, the phospho-ERK/ERK2 ratio is also shown for cells treated with U0126 for 30 min before the buffer challenges.
Figure 2.
Figure 2.
MEK1 promotes mitosis via Golgi disassembly. (A–C) The percentage of cells in mitosis (mitotic index) at the indicated times after thymidine release was determined for control and MEK1 siRNA-transfected cells (A) and control and U0126-treated cells (B). The mitotic index was also determined for unsynchronized cells after addition of U0126 for the indicated times (C). For knockdown cells, a double thymidine S-phase arrest protocol was used in which the first 24-h arrest was initiated upon transfection and lasted 24 h, and the second arrest was initiated after a 14-h incubation in the absence of thymidine and lasted 20 h. For U0126, treatment was initiated 2 h after thymidine release and consisted of growth media containing 10 μM U0126 and 0.1% DMSO or 0.1% DMSO alone. (D–F) To test whether delay required an intact Golgi apparatus, BFA treatment was used to disassemble the Golgi apparatus and the mitotic index was determined for synchronized MEK1 knockdown cells (D), synchronized U0126 treated cells (E), and nonsynchronized U0126 treated cells (F). For synchronized cells 2 μM BFA was added 5 h postthymidine release. For nonsynchronized cells, 2 μM BFA was added 2 h after U0126 addition (arrow). Note that in each assay MEK inhibition delayed mitotic entry and that BFA suppressed the delay. All values shown are averages ± SEM (n ≥ 3). (G–I) The mitotic progression data were analyzed using RMSD to quantify the degree to which the shown mitotic progression curves differ from one another. Results are shown for comparisons between control and MEK1 knockdown-synchronized cells (G), control and U0126-treated synchronized cells (H), and control and U0126-treated nonsynchronized cells (I). In the absence of BFA, significant differences caused by MEK inhibition were evident, and these differences were reduced by >50% in the presence of BFA.
Figure 3.
Figure 3.
GRASP65 depletion suppresses the MEK1 G2/M requirement. (A) Cell extracts (40 μg/lane) prepared 72 h after transfection with GRASP65 siRNA were analyzed by immunoblotting by using anti-GRASP65 (top) and anti-calnexin (bottom) antibodies. (B) The mitotic index of control and GRASP65 siRNA-transfected cells was determined at time points after release in the presence of U0126 or 0.1% DMSO carrier added at the 2-h time point (arrow). Values shown are averages ± SEM (n = 3). Note that the delay caused by MEK inhibition was absent in cells depleted of GRASP65. (C) Also shown is the RMSD comparison of the deviation between mitotic progression curves as indicated.
Figure 4.
Figure 4.
Mitotic Golgi disassembly does not require MEK. The Golgi and DNA patterns are shown in representative images of synchronized cells treated with control siRNA (top row), MEK1 siRNA (middle row), or 10 μM U0126 (bottom row) at the following cell cycle stages: S phase (S), prophase (P), prometaphase (PM), metaphase (M), anaphase (A), and telophase/cytokinesis (T/C).
Figure 5.
Figure 5.
Live imaging analysis of mitotic Golgi disassembly. (A–E) Synchronized HeLa cells stably expressing GalNAcT2-GFP were imaged by confocal microscopy at 37°C every 2 min (10 Z-axis slices per frame). Single frames from a movie are shown representing the starting Golgi ribbon (A), initial unlinking of the ribbon (B), final unlinking yielding the peak in fluorescent objects (C), initial conversion of fragments into vesicular haze (D), and end point of disassembly with metaphase plate outlined by vesicular haze (E). (F) Frame by frame analysis of multiple movies was carried out to determine the number fluorescent Golgi objects per cell. Values are normalized by plotting the fold increase over the baseline determined for each movie (average value of first 10 frames), and the plots are aligned in time by setting t = 0 at the fluorescent Golgi object peak. Values shown are averages ± SEM (n = 10), and the approximate position of the representative stages in breakdown is indicated. Note that initial Golgi unlinking marked by the shoulder preceding the disassembly peak (B) begins greater than 60 min before metaphase (E), placing this event in late G2 phase.
Figure 6.
Figure 6.
Decreased lateral mobility of GalNAcT2-GFP in late G2 cells. (A and B) Synchronized HeLa cells stably expressing GalNAcT2-GFP were arrested at S phase (A) by using thymidine or arrested in late G2 (B) by using olomoucine II treatment during the final 6 h of an 11-h thymidine washout incubation. The area of the Golgi indicated by the brackets was bleached by using a single laser pulse. Recovery of fluorescence was observed by live epifluorescence imaging (movies in Supplemental Figures S3 and S4). Representative images of the indicated time points are shown. Bar, 5 μm. (C) The ratio of fluorescence of the bleached area to an adjacent unbleached area was measured for each time point, normalized to the initial values, and plotted. Values shown are averages ± SEM (n = 3, ≥6 cells per treatment per experiment).
Figure 7.
Figure 7.
MEK-dependent Golgi unlinking before prophase. (A) Representative images show Hoechst-labeled DNA (left column), phospho-histone H3 immunofluorescence (center column) and the Golgi apparatus labeled by GalNAcT2-GFP (T2, right column) after fixation at the designated cell cycle stages, as determined by time from cell cycle release, DNA condensation status and the presence or absence of pp-H3 staining. Where indicated U0126 was added 5 h after thymidine release, and/or 10 μM olomocine II was added 7.5 h after release, and cells were maintained in olomoucine G2/M arrest for three more hours before fixation. (B) For quantitative analysis of Golgi linking in the populations shown in A, the NIH Image software package was used to automatically apply a threshold and count above-threshold fluorescent objects. Note that the analyzed cells were chosen on the basis of interphase DNA staining and not Golgi pattern. Average values ± SEM are shown (n = 3). (C) Histogram analysis showing the percentage of cells exhibiting the indicated number of Golgi fragments for control and U0126-treated late G2 cells. (D) Analysis of Golgi linking was carried out on synchronized NRK cells exactly as described for HeLa cells except that giantin immunofluorescence was used to visualize the Golgi apparatus. (E) Synchronized HeLa cells were subjected to shake off at a time corresponding to mitotic entry (8–9 h). Extracts (50 μg/lane) of the adherent (G2-phase) and released (M-phase) cells were analyzed for doubly phosphorylated ERK1/2 by immunoblotting. After stripping, the blot was reprobed to detect ERK2 as a loading control. Quantified values normalized by the ERK2 loading control are averages ± SEM (n = 3).
Figure 8.
Figure 8.
MEK inhibition prolongs mitotic entry. (A) HeLa cells were released from an arrest with 10 μM olomoucine II carried out in the presence of either U0126 or DMSO carrier. At time points after release, in the continued presence of U0126 or DMSO, the percentage of ppH3-positive cells in early prophase (weak punctate staining) was determined. (B) The experiment was performed identically except that 2 μM BFA was added 30 min before olomoucine release. Average values ± SEM are shown (n = 3).
Figure 9.
Figure 9.
Evidence that GRASP55 phosphorylation is required for timely G2/M. (A) Myc-GRASP55 (WT) and the myc-GRASP55T222,225A phosphorylation mutant (T222,225A) were transiently expressed, and the cells were synchronized in late G2 phase by using a 11-h thymidine release incubation in the presence of olomoucine II starting at 6 h. Expressing cells were identified by myc staining (Myc), and the Golgi was analyzed based on GalNAcT2-GFP (T2). (B) Golgi linking in the olomoucine-arrested cells expressing myc-GRASP55 or myc-GRASP55T222,225A, was then quantified by determining the number of fluorescent Golgi objects per cell (n = 3, ≥25 cells per treatment per experiment). (C) The integrated total percentage of visibly mitotic cells after S-phase release was determined for cells transfected with empty vector, or vectors encoding GRASP55 and GRASP55T222,225A. Also shown are the results obtained when BFA was added at 5 h after S-phase release to cause Golgi disassembly. All values are normalized to the empty vector control. Expression of GRASP55T222,225A decreased mitotic entry and this was suppressed by BFA addition. (D) Representative post mitotic couplet expressing myc-GRASP55 is shown (asterisks) after staining with anti-myc (red) and visualizing GalNAcT2-GFP (green). Bar, 4 μm. (E) Percentage of premitotic (singlets) and postmitotic (couplets) cells was determined 2 h after mitotic entry for cells expressing GRASP55 or GRASP55T222,225A. Expression-positive mitotic cells were included in the postmitotic count but were rarely observed due to diminished staining upon Golgi dispersal. Average values ± SEM are shown (n = 3). In comparison with GRASP55, recovery of postmitotic cells was dramatically reduced by GRASP55T222,225A expression (p < 0.05).

Similar articles

Cited by

References

    1. Abrieu A., Fisher D., Simon M. N., Doree M., Picard A. MAPK inactivation is required for the G2 to M-phase transition of the first mitotic cell cycle. EMBO J. 1997;16:6407–6413. - PMC - PubMed
    1. Acharya U., Mallabiabarrena A., Acharya J. K., Malhotra V. Signaling via mitogen-activated protein kinase kinase (MEK1) is required for Golgi fragmentation during mitosis. Cell. 1998;92:183–192. - PubMed
    1. Bachert C., Lee T. H., Linstedt A. D. Lumenal endosomal and Golgi-retrieval determinants involved in pH-sensitive targeting of an early Golgi protein. Mol. Biol. Cell. 2001;12:3152–3160. - PMC - PubMed
    1. Besson A., Davy A., Robbins S. M., Yong V. W. Differential activation of ERKs to focal adhesions by PKC epsilon is required for PMA-induced adhesion and migration of human glioma cells. Oncogene. 2001;20:7398–7407. - PubMed
    1. Bitangcol J. C., Chau A. S., Stadnick E., Lohka M. J., Dicken B., Shibuya E. K. Activation of the p42 mitogen-activated protein kinase pathway inhibits Cdc2 activation and entry into M-phase in cycling Xenopus egg extracts. Mol. Biol. Cell. 1998;9:451–467. - PMC - PubMed

Publication types

LinkOut - more resources