. 2006 Dec 15;20(24):3426-39.
doi: 10.1101/gad.406406.

Mitf regulation of Dia1 controls melanoma proliferation and invasiveness

Affiliations

Mitf regulation of Dia1 controls melanoma proliferation and invasiveness

Suzanne Carreira et al. Genes Dev. .

Abstract

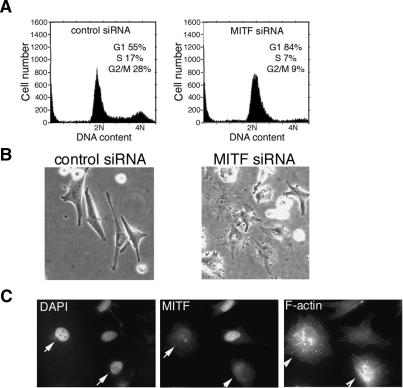
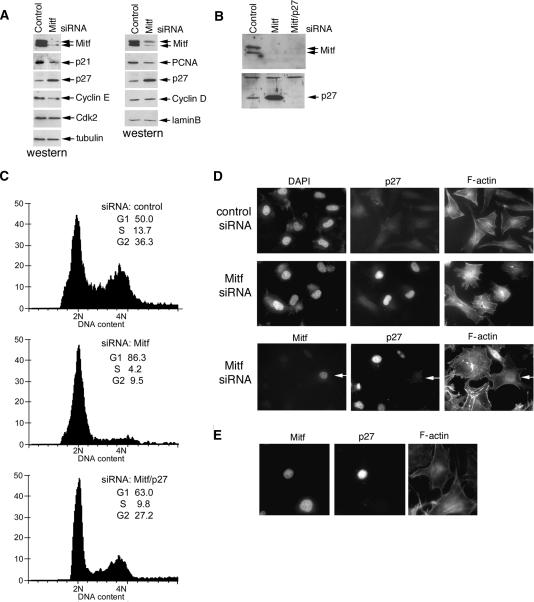
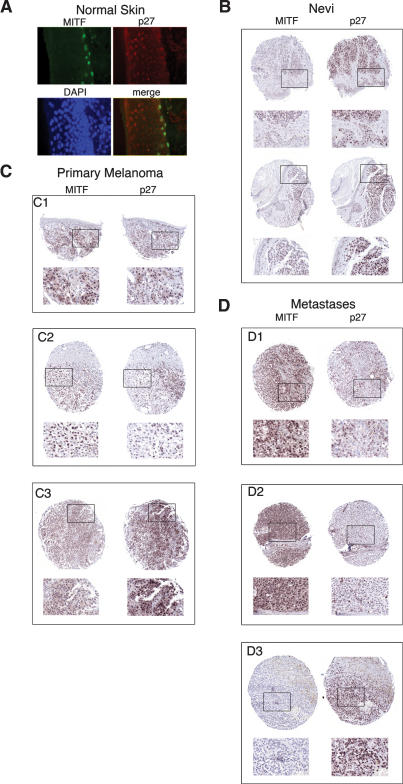
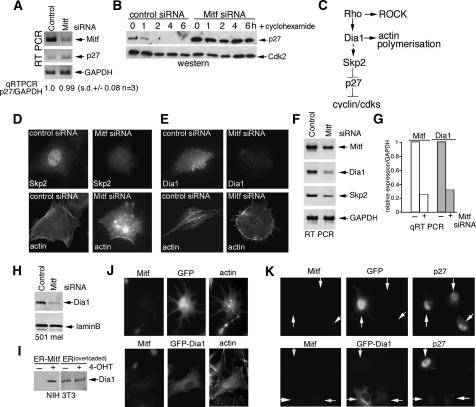
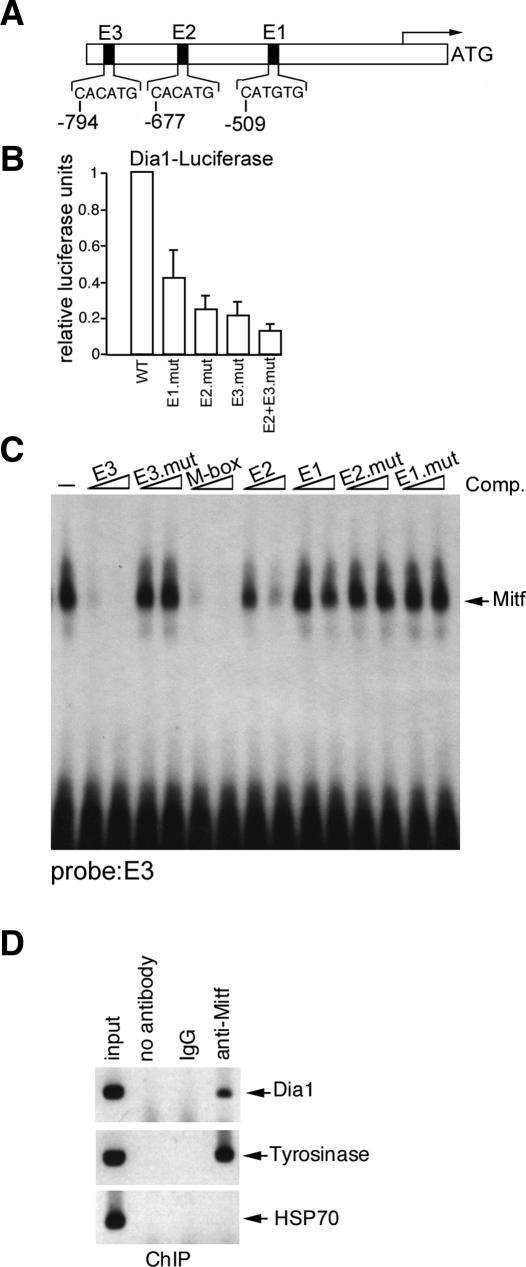
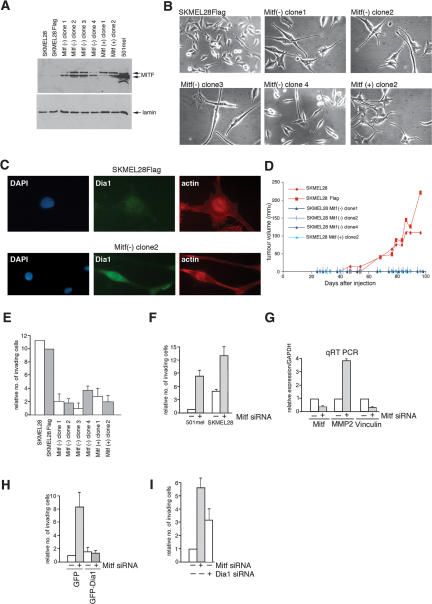
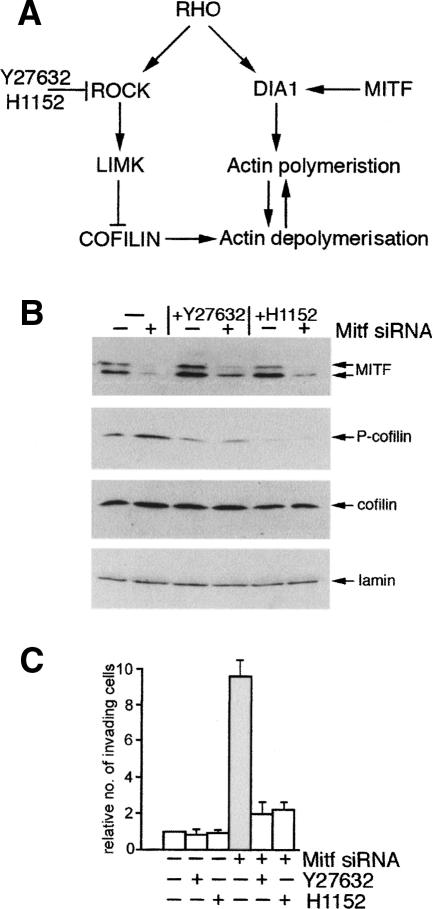
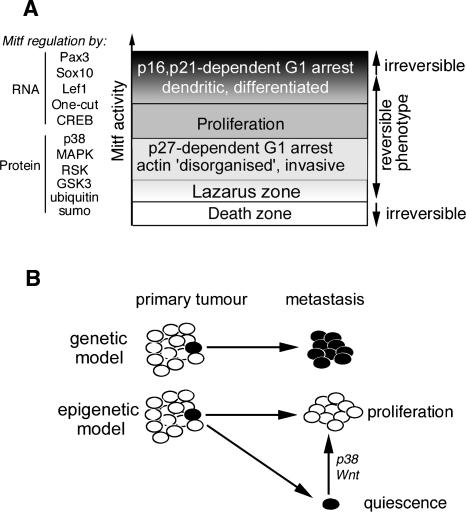
It is widely held that cells with metastatic properties such as invasiveness and expression of matrix metalloproteinases arise through the stepwise accumulation of genetic lesions arising from genetic instability and "clonal evolution." By contrast, we show here that in melanomas invasiveness can be regulated epigenetically by the microphthalmia-associated transcription factor, Mitf, via regulation of the DIAPH1 gene encoding the diaphanous-related formin Dia1 that promotes actin polymerization and coordinates the actin cytoskeleton and microtubule networks at the cell periphery. Low Mitf levels lead to down-regulation of Dia1, reorganization of the actin cytoskeleton, and increased ROCK-dependent invasiveness, whereas increased Mitf expression leads to decreased invasiveness. Significantly the regulation of Dia1 by Mitf also controls p27(Kip1)-degradation such that reduced Mitf levels lead to a p27(Kip1)-dependent G1 arrest. Thus Mitf, via regulation of Dia1, can both inhibit invasiveness and promote proliferation. The results imply variations in the repertoire of environmental cues that determine Mitf activity will dictate the differentiation, proliferative, and invasive/migratory potential of melanoma cells through a dynamic epigenetic mechanism.


Figures

Figure 1.
Figure 1.
Depletion of Mitf induces a G1 cell cycle arrest. (A) Flow cytometry of 501 mel melanoma cells treated with control or Mitf-specific siRNA1. (B) Phase image of control and Mitf-depleted cells. (C) Immunofluorescence assay of cells treated with Mitf-specific siRNA using anti-Mitf antibody or phalloidin to reveal F-actin. Arrows indicate Mitf-depleted cells.
Figure 2.
Figure 2.
Mitf depletion induces a p27Kip1-dependent cell cycle arrest. (A) Western blot of extracts from control or Mitf-depleted 501 mel cells using antibodies specific for the indicated proteins. Note that Mitf appears as two bands corresponding to hyper- and hypophosphorylated forms. (B) Western blot of 501 mel cells treated with control siRNA or siRNA1 specific for Mitf and/or p27Kip1-specific siRNA and probed with the indicated antibodies. (C) Flow cytometry of cells corresponding to those assayed by Western blotting in B. The p27Kip1-specific siRNA alone had no effect on the cell cycle profile (not shown). (D, top panels) Immunofluorescence using anti-p27Kip1 or Phalloidin to stain F-actin on 501 mel melanoma cells transfected with control or Mitf-specific siRNAs as indicated. (Bottom panels) Triple immunofluorescence assay showing p27Kip1 and F-actin expression in Mitf-depleted cells. Arrow indicates a control cell in which Mitf is not depleted. Note that all cells exhibiting Mitf depletion expressed elevated p27Kip1 levels and altered actin. (E) Ectopic overexpression of p27Kip1 does not affect F-actin organization. 501 mel cells were transfected with a p27Kip1 expression vector and subjected to triple immunofluorescence using anti-Mitf, anti-p27Kip1, and phalloidin.
Figure 3.
Figure 3.
Expression of Mitf and p27Kip1 in vivo. (A) Immunofluorescence assay on normal skin showing expression of Mitf (green), p27Kip1 (red), and DNA (blue). (B) Immunohistochemistry on Nevi using indicated primary antibodies. Boxed areas are shown as enlarged insets below. (C) Immunohistochemistry on primary melanomas using indicated primary antibodies. Indicated insets are shown below each section. (D) Immunohistochemistry on melanoma metastases using indicated primary antibodies. Indicated insets are shown below each section.
Figure 4.
Figure 4.
Mitf regulates p27Kip1 via Dia1. (A) RT–PCR of mRNA derived from control or Mitf-depleted 501 mel cells using primers specific for the indicated genes. (B) Western blot using anti-p27Kip1 or anti-Cdk2 antibodies of protein from control or Mitf-depleted cells treated with cyclohexamide for the indicated times. (C) Schematic showing how Rho signaling meditates up-regulation of p27Kip1 protein stability via Dia1 and Skp2. (D,E) Immunofluorescence showing actin and Skp2 or Dia1 levels in control or Mitf siRNA-treated 501 mel cells. (F) RT–PCR of mRNA derived from control or Mitf-depleted cells using primers specific for the indicated genes. (G) Real-time quantitative RT–PCR of Mitf and Dia1 mRNA from control or Mitf-depleted 501 mel cells as indicated. (H) Western blot using anti-Dia1 or anti-laminB antibodies of control or Mitf-depleted 501 mel cells. (I) Western blot using anti-Dia1 antibody of NIH 3T3 cells expressing ER-Mitf or ER only ±4-OHT as indicated. (J) Immunofluorescence using anti-Mitf or phalloidin staining on 501 mel cells depleted for Mitf using siRNA1 and transfected with either a GFP or GFP-Dia1 expression vector as indicated. (K) Immunofluorescence assay using anti-Mitf or anti-p27Kip1 antibodies on 501 mel cells depleted for Mitf using siRNA1 and transfected with either a GFP or GFP-Dia1 expression vector as indicated.
Figure 5.
Figure 5.
Direct regulation of the Dia1 promoter by Mitf. (A) Schematic showing the sequences of the putative Mitf-binding sites E1, E2, and E3 in the Dia1 promoter. (B) Results of luciferase assays in which 100 ng of WT or indicated Dia1 promoter mutants were transfected into 501 mel cells. Results represent the mean of three experiments and SD. (C) Band shift assay showing Mitf binding to a radiolabeled Dia1 E3 probe and competition using 10 or 50 ng or the indicated WT or mutant competitor oligonucleotides. (D) Chromatin immunoprecipitation using anti-Mitf, nonspecific IgG, or no antibody and PCR primers specific for the indicated genes.
Figure 6.
Figure 6.
Mitf depletion induces a hyperinvasive phenotype. (A) SKMEL28 cells were stably transfected with Mitf expression vectors for the Mitf(+) and Mitf(−) isoforms, clones were isolated, and expression of Mitf was determined by Western blotting. (B) Phase images showing that ectopic expression of Mitf leads to a more elongated morphology. (C) Immunofluorescence assay using indicated antibodies of control SKMel28-Flag cells or the Mitf(−)-expressing clone 2. Increased Dia1 expression was also observed using other Mitf-expressing SKMel28 cell lines (not shown). (D) Tumor formation in nude mice of SKMel28 cells or indicated derivatives ectopically expressing Mitf or containing an empty vector. (E) SKMel28 cells or indicated derivatives were assessed using a Matrigel assay for their invasive potential. Relative number of invasive cells in this assay means relative to the number of cells that invade using SKMel28-Flag control set to a value of 10. (F) Invasiveness of parental and Mitf-depleted 501 mel and SKmel28 cell lines determined using the Matrigel assay. Depletion was achieved using siRNA1, although similar results were obtained using a second independent Mitf siRNA2 (not shown). Quantification shows the mean fold difference from five independent assays. Relative number of invasive cells in this assay and all remaining assays presented means relative to the number of cells that invade using control siRNA in 501 mel cells set to a value of 1. (G) Quantitative RT–PCR of control or Mitf-depleted (siRNA1) 501 mel cells assayed using the indicated primers. (H) GFP or GFP-Dia1 expression vectors were used to transfect 501 mel cells treated with control of Mitf-specific siRNA and fluorescent cells were assayed for their ability to invade using a Matrigel assay. The results shown are normalized for the number of transfected cells. The number of cells invading is relative to that of the control siRNA transfected with GFP. (I) 501 mel cells were treated with control, Mitf, or Dia1-specific siRNA1 as indicated and assayed for invasiveness using the Matrigel assay. Relative number of invading cells refers to the number of cells invading using the control siRNA.
Figure 7.
Figure 7.
Reduced Mitf expression leads to a ROCK-dependent invasive phenotype. (A) Pathways downstream from Rho. (B) Western blot using indicated antibodies of control and Mitf-depleted 501 mel cells grown in the presence or absence of the ROCK inhibitors Y27632 and H1152 at 10 μM and 115 nM, respectively. (C) Invasiveness of 501 mel cells treated with indicated inhibitors, and control or Mitf-specific siRNA as indicated.
Figure 8.
Figure 8.
An epigenetic model for melanoma metastasis. (A) Model describing Mitf function in cell cycle control in melanoma cells. Mitf activity is regulated by a wide range of factors that act at the RNA and protein levels. Low levels of Mitf are required for survival as invasive G1 arrested cells with low Dia1, high p27KIP1, and disorganized actin; moderate Mitf activity promotes actin polymerization and suppresses p27KIP1expression leading to proliferation; and elevated Mitf leads to differentiation-associated G1-arrested cells with high levels of p16INK4A and p21CIP1. Activation of NRAS or BRAF would strongly down-regulate Mitf expression. (B) Epigenetic versus genetic models for metastasis. The traditional view is that accumulation of genetic lesions leads to a cell acquiring metastatic potential that will be retained in progeny within a metastasis. In contrast, the epigenetic model states that variations in the tumor microenvironment may lead to the acquisition of metastatic potential, (e.g., by down-regulating Mitf), but that once in a different environment at the site of metastasis, a reversal of the epigenetic change (e.g., up-regulation of Mitf) may lead to renewed proliferation. Alternatively, if the metastatic cell ends up in a different environment, long-term quiescence may ensue. A change in the status of Mitf—for example, by activation of the Wnt pathway or the p38 stress signaling pathway—might then lead to a resumption of proliferation and recurrence of disease many years after initial relapse.

Similar articles

Cited by

  • PGC-1 coactivators regulate MITF and the tanning response.
    Shoag J, Haq R, Zhang M, Liu L, Rowe GC, Jiang A, Koulisis N, Farrel C, Amos CI, Wei Q, Lee JE, Zhang J, Kupper TS, Qureshi AA, Cui R, Han J, Fisher DE, Arany Z. Shoag J, et al. Mol Cell. 2013 Jan 10;49(1):145-57. doi: 10.1016/j.molcel.2012.10.027. Epub 2012 Nov 29. Mol Cell. 2013. PMID: 23201126 Free PMC article.
  • Resistance to Targeted Therapy and RASSF1A Loss in Melanoma: What Are We Missing?
    McKenna S, García-Gutiérrez L. McKenna S, et al. Int J Mol Sci. 2021 May 12;22(10):5115. doi: 10.3390/ijms22105115. Int J Mol Sci. 2021. PMID: 34066022 Free PMC article. Review.
  • WNT Signaling in Melanoma.
    Gajos-Michniewicz A, Czyz M. Gajos-Michniewicz A, et al. Int J Mol Sci. 2020 Jul 9;21(14):4852. doi: 10.3390/ijms21144852. Int J Mol Sci. 2020. PMID: 32659938 Free PMC article. Review.
  • The small MAF transcription factor MAFG co-opts MITF to promote melanoma progression.
    Vera O, Martinez M, Soto-Vargas Z, Wang K, Xu X, Ruiz-Buceta S, Mecozzi N, Chadourne M, Posorske B, Angarita A, Bok I, Liu Q, Murikipudi H, Kim Y, Messina JL, Tsai KY, Major MB, Lau EK, Yu X, Ibanez-de-Caceres I, Karreth FA. Vera O, et al. bioRxiv [Preprint]. 2024 Sep 6:2024.09.03.611024. doi: 10.1101/2024.09.03.611024. bioRxiv. 2024. PMID: 39282450 Free PMC article. Preprint.
  • Loss of Ambra1 promotes melanoma growth and invasion.
    Di Leo L, Bodemeyer V, Bosisio FM, Claps G, Carretta M, Rizza S, Faienza F, Frias A, Khan S, Bordi M, Pacheco MP, Di Martino J, Bravo-Cordero JJ, Daniel CJ, Sears RC, Donia M, Madsen DH, Guldberg P, Filomeni G, Sauter T, Robert C, De Zio D, Cecconi F. Di Leo L, et al. Nat Commun. 2021 May 5;12(1):2550. doi: 10.1038/s41467-021-22772-2. Nat Commun. 2021. PMID: 33953176 Free PMC article.

References

    1. Alberts, A.S. Diaphanous-related Formin homology proteins. Curr. Biol. 2002;12:R796. - PubMed
    1. Alonso, S.R., Ortiz, P., Pollan, M., Perez-Gomez, B., Sanchez, L., Acuna, M.J., Pajares, R., Martinez-Tello, F.J., Hortelano, C.M., Piris, M.A., et al. Progression in cutaneous malignant melanoma is associated with distinct expression profiles: A tissue microarray-based study. Am. J. Pathol. 2004;164:193–203. - PMC - PubMed
    1. Arber, S., Barbayannis, F.A., Hanser, H., Schneider, C., Stanyon, C.A., Bernard, O., Caroni, P. Regulation of actin dynamics through phosphorylation of cofilin by LIM-kinase. Nature. 1998;393:805–809. - PubMed
    1. Bales, E.S., Dietrich, C., Bandyopadhyay, D., Schwahn, D.J., Xu, W., Didenko, V., Leiss, P., Conrad, N., Pereira-Smith, O., Orengo, I., et al. High levels of expression of p27KIP1 and cyclin E in invasive primary malignant melanomas. J. Invest. Dermatol. 1999;113:1039–1046. - PubMed
    1. Baylin, S.B., Ohm, J.E. Epigenetic gene silencing in cancer—A mechanism for early oncogenic pathway addiction? Nat. Rev. Cancer. 2006;6:107–116. - PubMed

Publication types

MeSH terms

Substances