. 2006 Dec 15;20(24):3440-52.
doi: 10.1101/gad.412606.

Muscle cachexia is regulated by a p53-PW1/Peg3-dependent pathway

Affiliations

Muscle cachexia is regulated by a p53-PW1/Peg3-dependent pathway

Martina Schwarzkopf et al. Genes Dev. .

Abstract

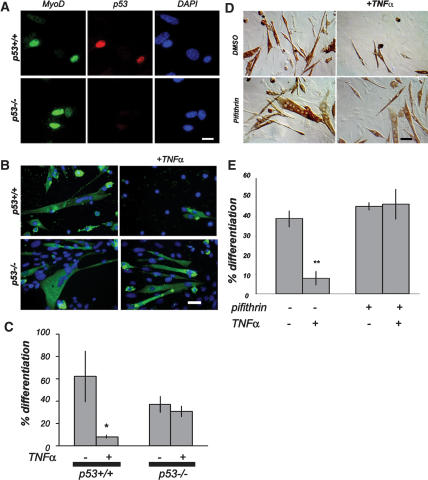
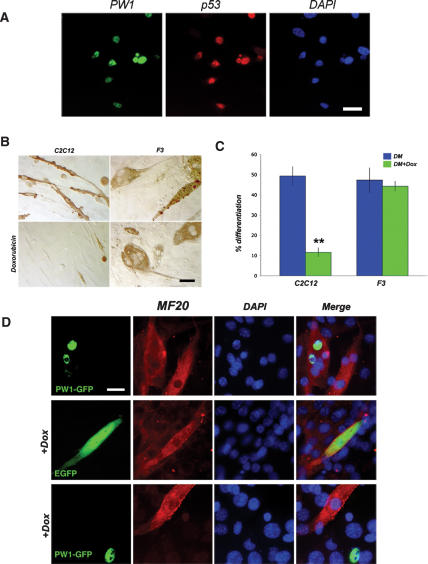
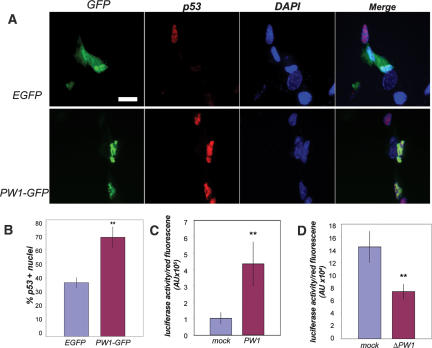
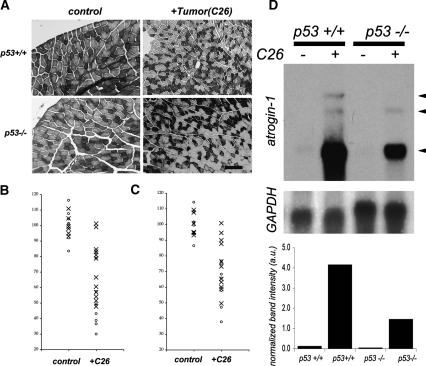
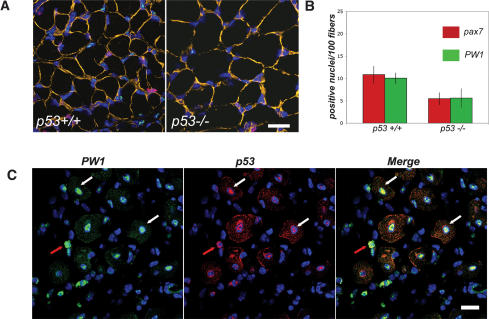
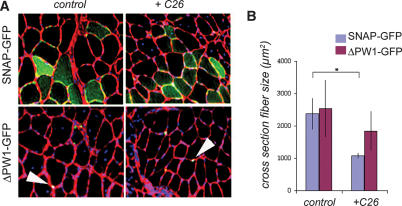
Muscle wasting (cachexia) is an incurable complication associated with chronic infection and cancers that leads to an overall poor prognosis for recovery. Tumor necrosis factor-alpha (TNFalpha) is a key inflammatory cytokine associated with cachexia. TNFalpha inhibits myogenic differentiation and skeletal muscle regeneration through downstream effectors of the p53 cell death pathway including PW1/Peg3, bax, and caspases. We report that p53 is required for the TNFalpha-mediated inhibition of myogenesis in vitro and contributes to muscle wasting in response to tumor load in vivo. We further demonstrate that PW1 and p53 participate in a positive feedback regulatory loop in vitro. Consistent with this observation, we find that the number of PW1-expressing stem cells in skeletal muscle declines significantly in p53 nullizygous mice. Furthermore, gene transfer of a dominant-negative form of PW1 into muscle tissue in vivo blocks myofiber atrophy in response to tumor load. Taken together, these results show a novel role for p53 in mediating muscle stem cell behavior and muscle atrophy, and point to new targets for the therapeutic treatment of muscle wasting.


Figures

Figure 1.
Figure 1.
p53 is expressed in myogenic cells and is required for TNFα-mediated inhibition of differentiation. (A) Myogenic cells were identified in primary muscle culture from p53+/+ and p53−/− mice by immunostaining for MyoD (green). Immunostaining for p53 (red) in p53+/+ cells reveals colocalization with MyoD-positive cells. p53−/− cell cultures were tested to verify the specificity of p53 detection. Nuclei were visualized by DAPI staining (blue). Bar, 5 μm. (B) Primary muscle cultures from p53+/+ and p53−/− mice were differentiated in the presence or absence of TNFα as indicated. MHC (green) was used to determine biochemical differentiation. TNFα blocks differentiation of p53+/+ myogenic cells, whereas p53−/− myogenic cells differentiate regardless of treatment. Nuclei were visualized by DAPI staining (blue). Bar, 10 μm. (C) Quantitative analysis of myogenic differentiation (% differentiation) of cells treated as described for B. TNFα treatment does not block differentiation of p53−/− myogenic cells. The values are presented as mean ± SD of at least three independent experiments. (*) p < 0.01 by Student’s t-test. (D) Confluent C2C12 cultured in DM with or without TNFα and/or the p53 inhibitor Pifithrin, as indicated. Immunolocalization of myosin was used as a marker of myogenic differentiation. C2C12 cells do not differentiate in the presence of TNFα. Differentiation is restored in the presence of Pifithrin. The final density of cells shown in D are close to confluence; however, only myotubes are stained. Bar, 30 μm. (E) Quantitative analysis of myogenic differentiation (% differentiation) of cells treated as described for D. Inhibition of p53 by Pifithrin rescues differentiation of C2 cells in the presence of TNFα. The values are presented as mean ± SD from at least three independent experiments. (**) p < 0.01 by Student’s t-test
Figure 2.
Figure 2.
PW1 confers p53 sensitivity in myogenic cells. (A) Immunolocalization of PW1 (green) and p53 (red) in proliferating primary myoblasts showing coexpression in vitro. Nuclei were visualized by DAPI (blue). Bar, 20 μm. (B) Myogenic cells cultured in DM in the presence or absence of Doxorubicin. Immunohistochemistry of myosin shows that C2C12 (PW1-expressing) cells do not differentiate in the presence of Doxorubicin. In contrast, F3 cells (PW1 negative) differentiate regardless of treatment. Bar, 30 μm. (C) The myogenic potentials of C2C12 and F3 cells cultured as shown in B were evaluated by quantitative analysis of myogenic differentiation (% differentiation). F3 cells are resistant to genotoxic stress-mediated inhibition of differentiation. Values are expressed as the mean ± SD of at least three independent experiments. (**) p < 0.01 by Student’s t-test. (D) F3 cells were transfected with either EGFP or PW1-GFP expression vector and induced to differentiate in the presence or absence of Doxorubicin. Myosin (red) was immunostained to assess differentiation in cells expressing either EGFP (green) or PW1-GFP (green). Nuclei were visualized by DAPI staining (blue). (Top panels) Ectopic PW1 expression in F3 cells does not affect differentiation. (Middle panels) F3 cells transfected with EGFP differentiate in the presence of Doxorubicin. (Bottom panels) In contrast, virtually all F3 cells expressing PW1-GFP fail to differentiate in the presence of Doxorubicin. Only PW1-negative F3 cells are myosin positive upon Doxorubicin treatment as shown in the middle and bottom panels. Bar, 15 μm.
Figure 3.
Figure 3.
PW1 up-regulates p53 expression and activity. (A) Immunofluorescence analysis of p53 expression in 10T1/2 fibroblasts. 10T1/2 cells were transfected with either EGFP or PW1-GFP expression vector (PW1-GFP) followed by immunolocalization of p53 (red). Nuclei were visualized by DAPI staining (blue). The results were subjected to quantitative analyses as shown below in B. Bar, 5 μm. (B) Quantification of p53-labeled 10T1/2 cells reveals a significant increase in p53-positive cells following PW1-GFP transfection. The values are the mean ± SD of 100–200 transfected cells in three independent experiments. (**) p < 0.01 by Student’s t-test. (C) Quantification of p53 activity using the p21–luciferase reporter construct. 10T1/2 cells transfected with PW1 show an increase in p53 transcriptional activity as compared with control (mock)-transfected 10T1/2 cells. Luciferase activity was normalized for transfection efficiency with a cotransfected RFP expression construct (see Materials and Methods) (**) p < 0.05 by Student’s t-test. (D) C2C12 cells transfected with the dominant-negative PW1 (ΔPW1) show a decrease in p53 transcriptional activity as compared with C2C12 cells transfected with control vector (mock). Luciferase activity was normalized for transfection efficiency as described above and in Materials and Methods. (**) p < 0.05 by Student’s t-test.
Figure 4.
Figure 4.
p53 regulates cancer-associated cachexia. (A) Representative photomicrographs of cross-sections from TA removed 3 wk following tumor grafting (+C26) or sham surgery (control). Sections were stained for NADH activity to identify fast (light staining) and slow (dark staining) fibers. Bar, 60 μm. (B) Changes in fast fiber sizes resulting from tumor graft (+C26) in p53+/+ (O) and p53−/− (X) mice. Data are represented as percentage of change from the mean value of controls as compared with values obtained from tumor-bearing mice within genotypic groups (p53+/+ and p53−/−). In tumor-bearing p53+/+ mice, the average fiber size decreases to 48% of control values (SD = 15%; p < 0.000005 by Student’s t-test). In contrast, fast fiber size in tumor-bearing p53−/− mice shows a less marked decrease to an average value of 74% of control values (SD = 17%; p < 0.001 by Student’s t-test). The decrease in fiber size due to tumor load is significantly more pronounced in p53+/+ mice as compared with p53−/− mice (p < 0.005 by Student’s t-test). (C) Changes in slow fiber size resulting from tumor implant (+C26) in p53+/+ (O) and p53−/− (X) mice. All comparisons were performed as described for B. In tumor-bearing p53+/+ mice, fiber size declines to an average value of 62% of control values (SD = 13%; p < 0.00002 by Student’s t-test). In contrast, fiber size in p53−/− tumor-bearing (+C26) mice declines to an average value of 75% of control values (SD 17%; p < 0.0005 by Student’s t-test). We note that loss of p53 has a less pronounced effect on changes in slow fiber size due to tumor load (p = 0.08) as compared with fast fibers (p < 0.005, see B). (D) Northern blot analysis for atrogin-1 transcripts (arrows) in p53+/+ and p53−/− muscles following (sham surgery, —) or tumor load (+C26). (Top and bottom panels) Mice subjected to sham surgery do not express detectable levels of atrogin-1. (Top and bottom panels) Following tumor implantation, p53+/+ mice show a marked up-regulation of atrogin-1, whereas p53−/− mice show only a modest increase in transcript levels. (Middle panel) GAPDH was used as a loading control. (Bottom panel) Densitometric analysis of total atrogin transcript levels are presented normalized against GAPDH, revealing a diminished increase in atrogin expression in p53−/− muscle as compared with p53+/+ muscle following tumor load.
Figure 5.
Figure 5.
p53 regulates myogenic stem cell number and colocalizes with PW1 in vivo. (A) Photomicrographs of representative cross-sections of 14-d-old hindlimb muscles from p53+/+ and p53−/− mice immunostained for PW1 (green), Pax7 (red), and laminin (orange). Nuclei were counterstained with DAPI (blue). We note that very few cells are positive for PW1 and Pax7 in the p53−/− muscles as compared with the wild type (p53+/+). Bar, 15 μm. (B) Quantification of PW1- and Pax7-positive cells per 100 fibers from sections as shown in A. p53−/− muscles show a statistically significant decrease in PW1- and Pax7-positive nuclei as compared with p53+/+. At least 100 fibers per randomly chosen field for each individual were counted and the mean value ± SD was calculated from at least three animals per genotype. (*) p < 0.05 by Student’s t-test. (C) Representative cross-sections of adult muscle 5 d after focal injury immunostained for PW1 (green) and p53 (red) and processed with DAPI (blue) to visualize nuclei. We note that both single cells (red arrow) and myonuclei (centrally located; indicated by white arrow) show expression of p53 during the regenerative myogenic response. We further note coexpression of p53 and PW1 in centrally located nuclei (white arrows) as well as in cells outside the muscle fibers (red arrows). Bar, 15 μm.
Figure 6.
Figure 6.
PW1 modulates fiber atrophy in response to tumor load. (A) Representative sections of TA electroporated with SNAP-GFP (green) or ΔPW1-GFP (green) from tumor-bearing (+C26) or control (sham-operated) mice. The basal lamina was visualized by laminin immunofluorescence (red), and nuclei were counterstained with DAPI (blue). SNAP-GFP appears throughout the myofiber, whereas ΔPW1-GFP fusion protein is restricted to nuclei (white arrowheads). Bar, 30 μm. (B) Quantification of transfected fiber cross-section area from muscles treated as shown in A. As expected, SNAP-GFP electroporated muscle fiber area decreases in response to tumor load (+C26). In contrast, ΔPW1-GFP-electroporated fibers do not show a significant size change in response to tumor load (+C26) as compared with controls. The values are presented as the mean ± SD of six animals. (*) p < 0.05 by Student’s t-test.

References

    1. Acharyya, S., Butchbach, M.E., Sahenk, Z., Wang, H., Saji, M., Carathers, M., Ringel, M.D., Skipworth, R.J., Fearon, K.C., Hollingsworth, M.A., et al. Dystrophin glycoprotein complex dysfunction: A regulatory link between muscular dystrophy and cancer cachexia. Cancer Cell. 2005;8:421–432. - PubMed
    1. Bodine, S.C., Stitt, T.N., Gonzalez, M., Kline, W.O., Stover, G.L., Bauerlein, R., Zlotchenko, E., Scrimgeour, A., Lawrence, J.C., Glass, D.J., et al. Akt/mTOR pathway is a crucial regulator of skeletal muscle hypertrophy and can prevent muscle atrophy in vivo. Nat. Cell Biol. 2001;3:1014–1019. - PubMed
    1. Cai, D., Frantz, J.D., Tawa, N.E., Jr., Melendez, P.A., Oh, B.C., Lidov, H.G., Hasselgren, P.O., Frontera, W.R., Lee, J., Glass, D.J., et al. IKKβ/NF-κB activation causes severe muscle wasting in mice. Cell. 2004;119:285–298. - PubMed
    1. Charge, S.B., Rudnicki, M.A. Cellular and molecular regulation of muscle regeneration. Physiol. Rev. 2004;84:209–238. - PubMed
    1. Chin, L., Artandi, S.E., Shen, Q., Tam, A., Lee, S.L., Gottlieb, G.J., Greider, C.W., DePinho, R.A. p53 deficiency rescues the adverse effects of telomere loss and cooperates with telomere dysfunction to accelerate carcinogenesis. Cell. 1999;97:527–538. - PubMed

Publication types

MeSH terms