. 2006 Dec 20;1(1):e12.
doi: 10.1371/journal.pone.0000012.

The effectiveness of contact tracing in emerging epidemics

Affiliations

The effectiveness of contact tracing in emerging epidemics

Don Klinkenberg et al. PLoS One. .

Abstract

Background: Contact tracing plays an important role in the control of emerging infectious diseases, but little is known yet about its effectiveness. Here we deduce from a generic mathematical model how effectiveness of tracing relates to various aspects of time, such as the course of individual infectivity, the (variability in) time between infection and symptom-based detection, and delays in the tracing process. In addition, the possibility of iteratively tracing of yet asymptomatic infecteds is considered. With these insights we explain why contact tracing was and will be effective for control of smallpox and SARS, only partially effective for foot-and-mouth disease, and likely not effective for influenza.

Methods and findings: We investigate contact tracing in a model of an emerging epidemic that is flexible enough to use for most infections. We consider isolation of symptomatic infecteds as the basic scenario, and express effectiveness as the proportion of contacts that need to be traced for a reproduction ratio smaller than 1. We obtain general results for special cases, which are interpreted with respect to the likely success of tracing for influenza, smallpox, SARS, and foot-and-mouth disease epidemics.

Conclusions: We conclude that (1) there is no general predictive formula for the proportion to be traced as there is for the proportion to be vaccinated; (2) variability in time to detection is favourable for effective tracing; (3) tracing effectiveness need not be sensitive to the duration of the latent period and tracing delays; (4) iterative tracing primarily improves effectiveness when single-step tracing is on the brink of being effective.


Conflict of interest statement

Competing Interests: The authors have declared that no competing interests exist.

Figures

Figure 1
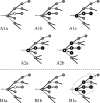
Figure 1. Single-step and iterative tracing on an epidemic tree, developing from left to right.
Nodes are infecteds, lines are contacts, contactees that were not infected are not represented on the tree. Grey infecteds are asymptomatic, white infecteds are symptomatic, infecteds with a thick border are isolated or quarantined. Solid lines are traceable contacts, dotted lines are untraceable contacts. A. Single-step tracing. In A1a-c, a symptomatic infected is isolated and his traceable contactees are quarantined. In A2a-b (some time later), one of the quarantined infecteds got symptomatic and his traceable contactees are quarantined. B. Iterative tracing. In B1a-c, a symptomatic infected is isolated and all infecteds directly or indirectly linked to this infected by traceable contacts are quarantined. All quarantined infecteds form a traceable cluster.
Figure 2
Figure 2. The effectiveness of single-step contact tracing without tracing delays.
Effectiveness is expressed as the minimum proportion of contacts that need to be traced for effective control (critical tracing probability pc*). The plots show pc* as a function of the latent period relative to the mean time to detection (τlat). There are four special cases: A. Short infectious period and variable time to detection; B. Short infectious period and fixed detection time; C. Long infectious period and variable time to detection; and D. Long infectious period and fixed detection time. The three curves denote pc* for different values of the pre-isolation reproduction ratio R 0 pre. Indicated by dashed lines are the average τlat for four infections, in the panels with closest correspondence to the actual parameter values (Table 2). Influenza appears in two panels with long and short infectious period, because it corresponds to both parameter sets equally.
Figure 3
Figure 3. The effectiveness of single-step contact tracing with tracing delays, with the pre-detection reproduction ratio R 0 pre = 1.5.
Effectiveness is expressed as the minimum proportion of contacts that need to be traced for effective control (critical tracing probability pc*). The contour plots show pc* as a function of the tracing delay δ and the latent period τlat, measured relative to the mean detection time, for four special cases: A. Short infectious period and variable incubation period; B. Short infectious period and fixed incubation period; C. Long infectious period and variable incubation period; and D. Long infectious period and fixed incubation period. Dark grey shadows indicate areas where tracing is ineffective, light grey shadows indicate areas where pc* = 0.33. Indicated by dashed lines are the average τlat for four infections, in the panels with closest correspondence to the actual parameter values (Table 2). Influenza appears in two panels with long and short infectious period, because it corresponds to both parameter sets equally.
Figure 4
Figure 4. The effectiveness of single-step and iterative contact tracing for control of influenza, smallpox, SARS, and foot-and-mouth disease.
Effectiveness is expressed as the minimum proportion of contacts that need to be traced for effective control (critical tracing probability pc*); pc* is plotted as a function of the relative delay (δ, proportion of the incubation period) or the absolute delay (days).

References

    1. Fenner F, Henderson DA, Arita I, Ježek Z, Ladnyi ID. Smallpox and its eradication. Geneva: World Health Organization; 1988.
    1. Donnelly CA, Ghani AC, Leung GM, Hedley AJ, Fraser C, et al. Epidemiological determinants of spread of causal agent of severe acute respiratory syndrome in Hong Kong. Lancet. 2003;361:1761–1766. - PMC - PubMed
    1. Ferguson NM, Donnelly CA, Anderson RM. Transmission intensity and impact of control policies on the foot and mouth epidemic in Great Britain. Nature. 2001;413:542–548. - PubMed
    1. Fraser C, Riley S, Anderson RM, Ferguson NM. Factors that make an infectious disease outbreak controllable. Proc Natl Acad Sci USA. 2004;101:6146–6151. - PMC - PubMed
    1. Lloyd-Smith JO, Galvani AP, Getz WM. Curtailing transmission of severe acute respiratory syndrome within a community and its hospital. Proc R Soc London B. 2003;270:1979–1989. - PMC - PubMed

MeSH terms