. 2006 Dec 20;1(1):e14.
doi: 10.1371/journal.pone.0000014.

Cognitive aging in zebrafish

Affiliations

Cognitive aging in zebrafish

Lili Yu et al. PLoS One. .

Abstract

Background: Age-related impairments in cognitive functions represent a growing clinical and social issue. Genetic and behavioral characterization of animal models can provide critical information on the intrinsic and environmental factors that determine the deterioration or preservation of cognitive abilities throughout life.

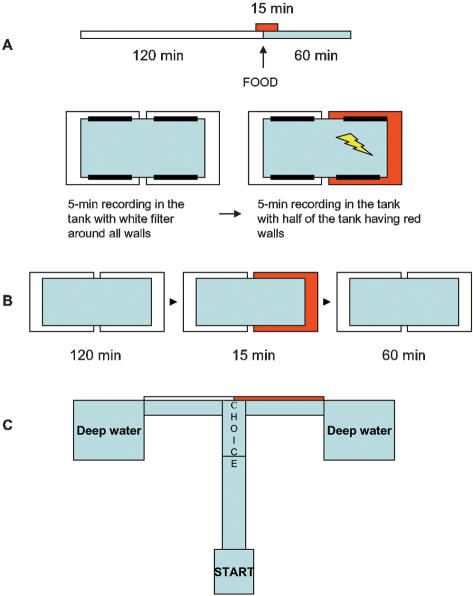
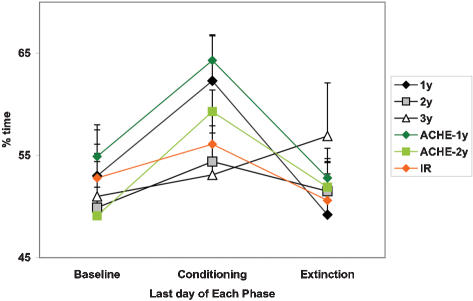
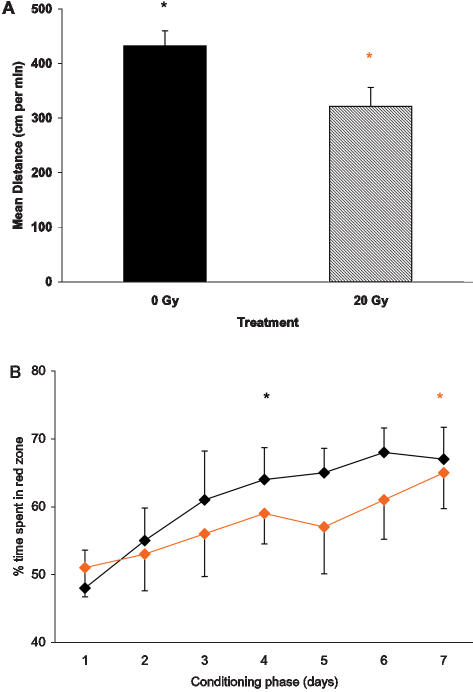
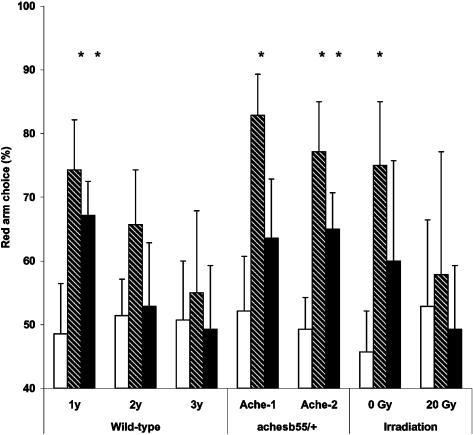
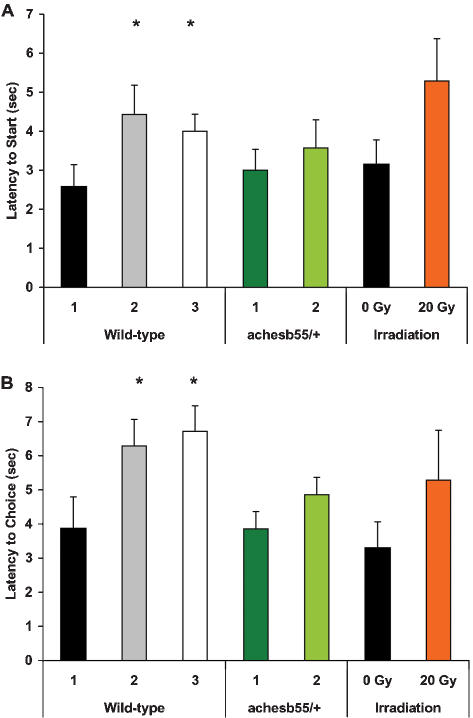
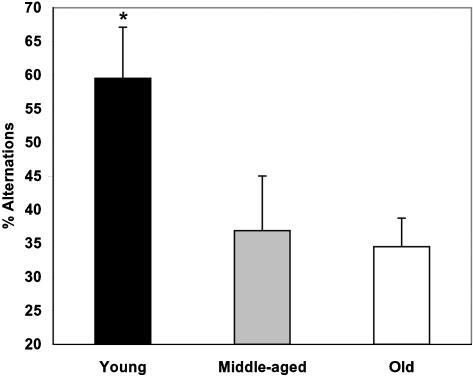
Methodology/principal findings: Behavior of wild-type, mutant and gamma-irradiated zebrafish (Danio rerio) was documented using image-analysis technique. Conditioned responses to spatial, visual and temporal cues were investigated in young, middle-aged and old animals. The results demonstrate that zebrafish aging is associated with changes in cognitive responses to emotionally positive and negative experiences, reduced generalization of adaptive associations, increased stereotypic and reduced exploratory behavior and altered temporal entrainment. Genetic upregulation of cholinergic transmission attenuates cognitive decline in middle-aged achesb55/+ mutants, compared to wild-type siblings. In contrast, the genotoxic stress of gamma-irradiation accelerates the onset of cognitive impairment in young zebrafish.

Conclusions/significance: These findings would allow the use of powerful molecular biological resources accumulated in the zebrafish field to address the mechanisms of cognitive senescence, and promote the search for therapeutic strategies which may attenuate age-related cognitive decline.


Conflict of interest statement

Competing Interests: The authors have declared that no competing interests exist.

Figures

Figure 1
Figure 1. Schematic illustrations of the methodological approaches used.
A. Time schedule of CPP procedure: 120 min of baseline recording without food in all-white tank, followed by 60 min of recording after food administration. Red color was present for 15 min, starting 5 min prior to food administration. B. CPA procedure: Each day, zebrafish behavior was recorded first in the test tank with all white walls (5 min), then for 5 min after half of the tank walls changed to red color. Horizontal black bars - stimulating electrodes. Electric shock (yellow “lightening”) delivered only in the red zone. C. T-maze with Start and Choice zones, inserted color filters and deep water end compartments. The apparatus (30 mm water level) included a starting zone, 40 × 30 mm, separated from the rest of the maze by a transparent removable partition. Behind the partition, there was a long 80 × 20 mm arm and two short 60 × 20 mm arms, which lead to the removable deep water chambers (85 mm water level).
Figure 2
Figure 2. Development of anticipatory increase in locomotor activity prior to food administration in wildtype (A) and ACHE mutants (B) of different age, and in IR zebrafish (C).
X-axis: % change in activity level within 30 min prior to food administration, as compared to preceding 90-min period. First day of significant (p<.05) change in group behavior in young (*) and middle-aged (**) fish. Note that BL was assessed after 7 days of new timing of daily food administration in white/white environment. Young fish – diamond, middle-aged fish – square, old fish – triangle. Wildtype – black; ACHE mutants – green; IR zebrafish – orange.
Figure 3
Figure 3. Spatial entrainment in zebrafish groups.
Percent time spent in the US-associated side of the tank during food anticipation, i.e., 30 min interval prior to CS presentation, at the end of Baseline, Conditioning and Extinction phases. Young fish (1 y) – diamond, middle-aged (2 y) fish – square, old fish (3 y) – triangle. Wildtype – black; ACHE mutants – green; IR zebrafish – orange.
Figure 4
Figure 4. Baseline locomotor activity level is significantly reduced in middle-aged (2 years old) and old (3 year old) fish, compared to young (1 year old) zebrafish.
Y axis: mean distance traversed. Solid color of each bar – slow motion; diagonal part –fast motion. * p<0.05 for comparisons between young and middle-aged, and p<0.001 between young and old zebrafish. No significant difference between two older groups.
Figure 5
Figure 5. Learning curves in fish of different age: wildtype (A), ACHE mutants (B).
Increase in time spent in the red zone during 5 min of red color presentation prior to food administration, compared to the same group behavior at Day 1. Young fish – diamond, middle-aged fish – square, old fish – triangle. First day of significant change in group behavior, * p<0.01 in young wildtype and mutant fish. # p<.05 in middle-aged wildtype.
Figure 6
Figure 6. Changes in performance in young zebrafish 7 months after whole body gamma-irradiation, compared to same age control.
A: Reduction in locomotor activity in the irradiated zebrafish (distance traversed). B: Reduction in developing CPP; time spent in the red half of the tank during 5 min of red color presentation prior to food administration. * 0 Gy or * 20 Gy p<0.05, in A: relative to Control; in B: relative to day 1 for the same group.
Figure 7
Figure 7. Change in place preference during and following Extinction.
Percent time spent in the red half of the test tank 5 min prior to food administration on the last day of Conditioning (day 7, diagonal bar), same side of the tank on the last day of Extinction (day 11 in white-white test tank; black bar) and during post-extinction presentation of red color (day 12; dotted bar). Y-axis: % time spent in the red half of the tank (or corresponding half on day 11). X-axis – zebrafish age. * p<0.05 relative to each group's end of Extinction, day 11.
Figure 8
Figure 8. Generalization of red color preference in a “different condition” of the T-maze at Baseline, following Conditioning and Extinction phases of CPP paradigm.
Y-axis: percent of red arm choices over 14 consecutive trials. X-axis – zebrafish age/strain. White bar – Baseline; diagonal pattern – after Conditioning, black – after Extinction. * p<0.05 relative to each group Baseline.
Figure 9
Figure 9. Latency to Start (A) and Choice (B) at Baseline T-maze test in different groups of zebrafish.
X-axis – fish age (years) and treatment. * p<0.01, relative to young control of the same strain or treatment group.
Figure 10
Figure 10. Increased alternation in the consecutive choice of the short arms of the maze during Baseline trials in young zebrafish, compared to middle-aged and old groups.
Y-axis: % alternation. * p<0.05, relative to each of the older groups.
Figure 11
Figure 11. Conditioned place avoidance (CPA) in wild-type young (A) and middle-aged (B) zebrafish.
Y-axis: % time spent in the red zone of the test tank at Baseline (BL), during Conditioning and Extinction phases of the study. Conditioning phase: * p<0.00001 for main group and training day effects; no significant difference between age groups. Extinction phase: between group comparison: p<0.0003, <0.0001 and <0.0001 for day 4, 5 and 6, respectively; within middle-aged group comparison, relative to Baseline, p<0.01, NS and NS for day 4, 5 and 6 respectively; within young group, p<0.0001, NS and <0.02 for day 4, 5 and 6, respectively.
Figure 12
Figure 12. Generalization of red color avoidance in the T-maze condition, following training in negative reinforcement paradigm in young and middle-aged zebrafish.
Y-axis: % time young (black) or middle-aged (gray) zebrafish spent outside red color zone of the tank at Baseline, following Conditioning or Extinction phases. *p<0.001, relative to Baseline.

References

    1. Sarter M, Bruno JP. Developmental origins of the age-related decline in cortical cholinergic function and associated cognitive abilities. Neurobiol Aging. 2004;25((9)):1127–1139. - PubMed
    1. Craik FI, Bialystok E. Cognition through the lifespan: mechanisms of change. Trends Cogn Sci. 2006;10((3)):131–138. - PubMed
    1. Schaffitzel E, Hertweck M. Recent aging research in Caenorhabditis elegans. Exp Gerontol. 2006;41((6)):557–63. - PubMed
    1. Peters A. The effects of normal aging on myelin and nerve fibers: a review. J Neurocytol. 2002;31((8–9)):581–593. - PubMed
    1. Gerhard GS. Comparative aspects of zebrafish (Danio rerio) as a model for aging research. Exp Gerontol. 2003;38((11–12)):1333–1341. - PubMed

Publication types

MeSH terms

LinkOut - more resources