. 2006 Dec 20;1(1):e35.
doi: 10.1371/journal.pone.0000035.

Restructuring of pancreatic islets and insulin secretion in a postnatal critical window

Affiliations

Restructuring of pancreatic islets and insulin secretion in a postnatal critical window

Cristina Aguayo-Mazzucato et al. PLoS One. .

Abstract

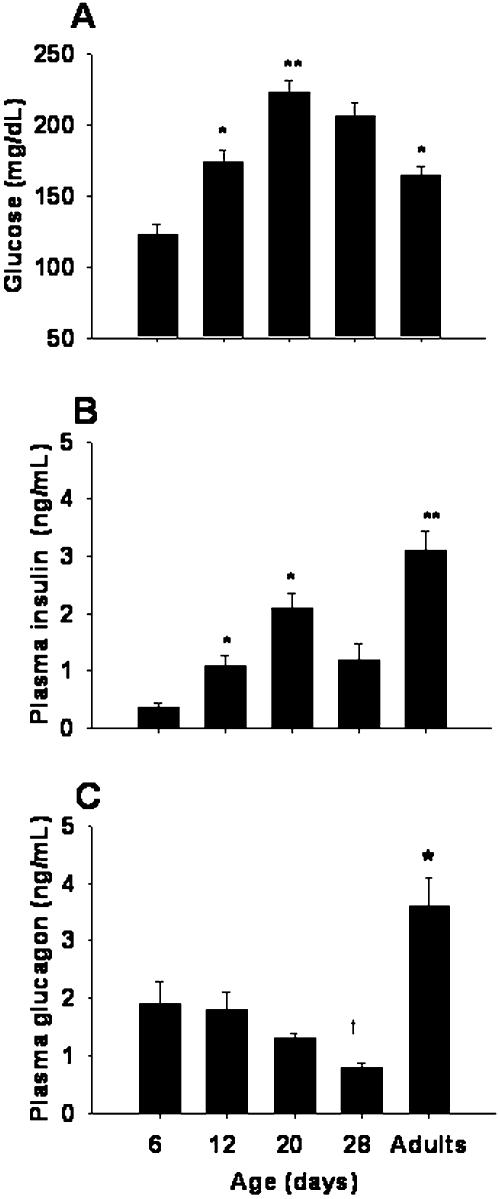
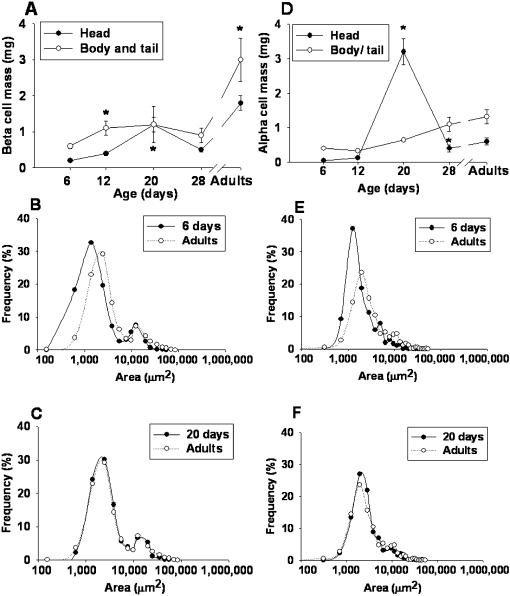
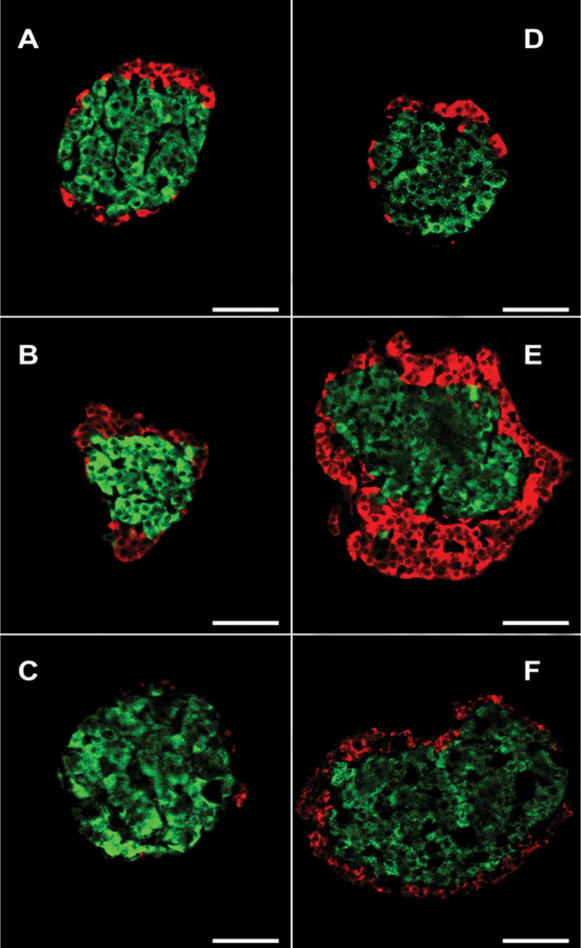
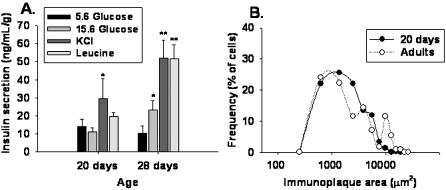
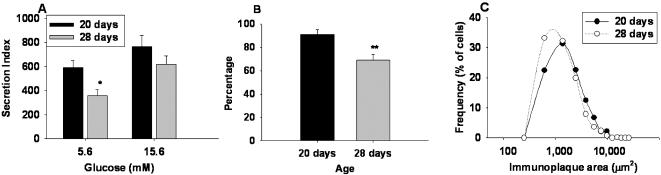
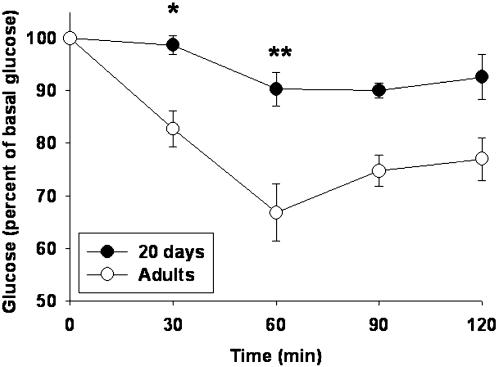
Function and structure of adult pancreatic islets are determined by early postnatal development, which in rats corresponds to the first month of life. We analyzed changes in blood glucose and hormones during this stage and their association with morphological and functional changes of alpha and beta cell populations during this period. At day 20 (d20), insulin and glucose plasma levels were two- and six-fold higher, respectively, as compared to d6. Interestingly, this period is characterized by physiological hyperglycemia and hyperinsulinemia, where peripheral insulin resistance and a high plasmatic concentration of glucagon are also observed. These functional changes were paralleled by reorganization of islet structure, cell mass and aggregate size of alpha and beta cells. Cultured beta cells from d20 secreted the same amount of insulin in 15.6 mM than in 5.6 mM glucose (basal conditions), and were characterized by a high basal insulin secretion. However, beta cells from d28 were already glucose sensitive. Understanding and establishing morphophysiological relationships in the developing endocrine pancreas may explain how events in early life are important in determining adult islet physiology and metabolism.


Conflict of interest statement

Competing Interests: The authors have declared that no competing interests exist.

Figures

Figure 1
Figure 1. Plasmatic glucose and hormone levels at different ages.
(A) Glucose concentration (n  =  12 animals/point); (B) plasma levels of insulin (n  =  12), and (C) plasma levels of glucagon (n  =  6). Symbols denote statistically significant differences, (*) p<0.05 and (**) p<0.0001 with respect to previous age, (†) p<0.05 with respect to d6.
Figure 2
Figure 2. Structural changes of pancreatic beta and alpha cells during the first month of life.
(A) The mass of beta cells in the head and tail of the gland. (B) Frequency distribution of beta cell aggregates at d6 and d90. (C) Comparison between d20 and d90. Data were pooled from 8 rats, n  =  9 216 beta cell aggregates measured. (D) Mass of alpha cells in the head and tail during the first month of life. (E, F) Frequency distribution of the size of alpha cell aggregates at d6, d20 and d90. (E) Comparisons between d6 and d90. (F) Comparisons between d20 and d90. Data were pooled from 4 rats, n  =  1 739 alpha cell aggregates measured, are expressed as mean ± SEM. Symbols denote statistically significant differences: (*) p < 0.05 with respect to previous age.
Figure 3
Figure 3. Islet composition changes in pancreatic head and tail at d6, 20 and adults.
Photomicrographs illustrate the overall distribution of alpha (red) and beta (green) cells in representative islets of the head (A–C) and body/tail (D–F) at d6 (A and D), d20 (B and E) and adults (C and F). Scale bar  =  50 µm.
Figure 4
Figure 4. Insulin secretion and functional subpopulations from isolated beta cells at d20 and d28.
(A) Bar graphs represent the release of insulin by isolated d20 and d28 beta cells in response to glucose, 40 mM KCl and 10 mM leucine, measured by ELISA; mean ± SEM, n  =  3 experiments by duplicate. Symbols denote statistically significant differences, (*) p<0.01 with respect to control, (**) p<0.001 with respect to control. (B) Frequency distribution of insulin immunoplaque areas of beta cells at d20 and d90 stimulated with 15.6 mM glucose, measured by a RHPA; n  =  4 experiments by duplicate.
Figure 5
Figure 5. Insulin secretion at d20 and d28 explored by RHPA.
(A) Bar graphs represent insulin secretion index at d20 and d28, in response to different glucose concentrations, mean ± SEM, n  =  4 experiments by duplicate, (*) p<0.05 with respect to 15.6 mM. (B) Percentage of insulin secreting beta-cells from the total population as identified by insulin immunocytochemistry after the RHPA; mean ± SEM, n  =  4 experiments by duplicate, **p<0.0001 with respect to d20. (C) Pancreatic beta cell subpopulations at d20 and d28 in response to basal, 5.6 mM glucose. Data pooled from 3 experiments by duplicate.
Figure 6
Figure 6. Insulin tolerance test (ITT) at d20 and adults.
ITTs were performed in groups (n  =  6) of anesthetized 20d and adult rats. Insulin (0.2 U/kg) was administered iv via a femoral catheter and blood samples were withdrawn for glucose measurements at the times shown; (*) p<0.05 with respect to adults.

Similar articles

Cited by

References

    1. Lucas A. Programming by early nutrition. An experimental approach. J Nutr. 1998;128:401S–406S. - PubMed
    1. Slack JMW. Developmental biology of the pancreas. Development. 1995;121:1569–1580. - PubMed
    1. Hughes SJ. The role of reduced glucose transporter content and glucose metabolism in the immature secretory responses of fetal rat pancreatic islets. Diabetologia. 1994;37:134–140. - PubMed
    1. Hole RL, Pian-Smith MC, Sharp GW. Development of the biphasic response to glucose in fetal and neonatal rat pancreas. Am J Physiol. 1988;254:E167–32. - PubMed
    1. Heinze E, Steinke J. Glucose metabolism of isolated pancreatic islets: difference between fetal, newborn and adult rats. Endocrinology. 1971;88:1259–1263. - PubMed

Publication types

MeSH terms