Expression of transgenes targeted to the Gt(ROSA)26Sor locus is orientation dependent
- PMID: 17183668
- PMCID: PMC1762389
- DOI: 10.1371/journal.pone.0000004
Expression of transgenes targeted to the Gt(ROSA)26Sor locus is orientation dependent
Abstract
Background: Targeting transgenes to a chosen location in the genome has a number of advantages. A single copy of the DNA construct can be inserted by targeting into regions of chromatin that allow the desired developmental and tissue-specific expression of the transgene.
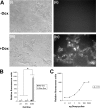
Methodology: In order to develop a reliable system for reproducibly expressing transgenes it was decided to insert constructs at the Gt(ROSA)26Sor locus. A cytomegalovirus (CMV) promoter was used to drive expression of the Tetracycline (tet) transcriptional activator, rtTA2(s)-M2, and test the effectiveness of using the ROSA26 locus to allow transgene expression. The tet operator construct was inserted into one allele of ROSA26 and a tet responder construct controlling expression of EGFP was inserted into the other allele.
Conclusions: Expression of the targeted transgenes was shown to be affected by both the presence of selectable marker cassettes and by the orientation of the transgenes with respect to the endogenous ROSA26 promoter. These results suggest that transcriptional interference from the endogenous gene promoter or from promoters in the selectable marker cassettes may be affecting transgene expression at the locus. Additionally we have been able to determine the optimal orientation for transgene expression at the ROSA26 locus.
Conflict of interest statement
Figures


Similar articles
-
A modified RMCE-compatible Rosa26 locus for the expression of transgenes from exogenous promoters.PLoS One. 2012;7(1):e30011. doi: 10.1371/journal.pone.0030011. Epub 2012 Jan 13. PLoS One. 2012. PMID: 22253858 Free PMC article.
-
Comparative study on the expression characteristics of transgenes inserted into the Gt(ROSA)26Sor and H11 loci in mice.Acta Biochim Biophys Sin (Shanghai). 2024 May 15;56(11):1687-1698. doi: 10.3724/abbs.2024081. Acta Biochim Biophys Sin (Shanghai). 2024. PMID: 38752269 Free PMC article.
-
Tetracycline-controlled transgene activation using the ROSA26-iM2-GFP knock-in mouse strain permits GFP monitoring of DOX-regulated transgene-expression.BMC Dev Biol. 2010 Sep 3;10:95. doi: 10.1186/1471-213X-10-95. BMC Dev Biol. 2010. PMID: 20815887 Free PMC article.
-
Improved applications of the tetracycline-regulated gene depletion system.Biosci Trends. 2009 Oct;3(5):161-7. Biosci Trends. 2009. PMID: 20103842 Review.
-
Gene targeting in mice: a review.Methods Mol Biol. 2013;1064:315-36. doi: 10.1007/978-1-62703-601-6_23. Methods Mol Biol. 2013. PMID: 23996268 Free PMC article. Review.
Cited by
-
Transgene expression is associated with copy number and cytomegalovirus promoter methylation in transgenic pigs.PLoS One. 2009 Aug 18;4(8):e6679. doi: 10.1371/journal.pone.0006679. PLoS One. 2009. PMID: 19688097 Free PMC article.
-
Investigation of the molecular biology underlying the pronounced high gene targeting frequency at the Myh9 gene locus in mouse embryonic stem cells.PLoS One. 2020 Mar 30;15(3):e0230126. doi: 10.1371/journal.pone.0230126. eCollection 2020. PLoS One. 2020. PMID: 32226034 Free PMC article.
-
A modified RMCE-compatible Rosa26 locus for the expression of transgenes from exogenous promoters.PLoS One. 2012;7(1):e30011. doi: 10.1371/journal.pone.0030011. Epub 2012 Jan 13. PLoS One. 2012. PMID: 22253858 Free PMC article.
-
Efficient expression from one CMV enhancer controlling two core promoters.Mol Biotechnol. 2011 Jun;48(2):128-37. doi: 10.1007/s12033-010-9353-7. Mol Biotechnol. 2011. PMID: 21113688
-
A Cell/Cilia Cycle Biosensor for Single-Cell Kinetics Reveals Persistence of Cilia after G1/S Transition Is a General Property in Cells and Mice.Dev Cell. 2018 Nov 19;47(4):509-523.e5. doi: 10.1016/j.devcel.2018.10.027. Dev Cell. 2018. PMID: 30458140 Free PMC article.
References
-
- Lewandoski M. Conditional control of gene expression in the mouse. Nature Rev Genet. 2001;2:743–755. - PubMed
-
- Gossen M, Bujard H. Studying gene function in eukaryotes by conditional gene inactivation. Annu Rev Genet. 2002;36:153–173. - PubMed
-
- Triezenberg SJ, Kingsbury RC, McKnight SL. Functional dissection of VP16, the trans-activator of herpes simplex virus immediate early gene expression. Genes Dev. 1988;2:718–729. - PubMed
-
- Gossen M, Freundlieb S, Bender G, Muller G, Hillen W, et al. Transcriptional activation by tetracyclines in mammalian cells. Science. 1995;268:1766–1769. - PubMed
Publication types
MeSH terms
Substances
Grants and funding
LinkOut - more resources
Full Text Sources
Other Literature Sources
Miscellaneous

