. 2006 Dec 20;1(1):e72.
doi: 10.1371/journal.pone.0000072.

Selection for heterozygosity gives hope to a wild population of inbred wolves

Affiliations

Selection for heterozygosity gives hope to a wild population of inbred wolves

Staffan Bensch et al. PLoS One. .

Abstract

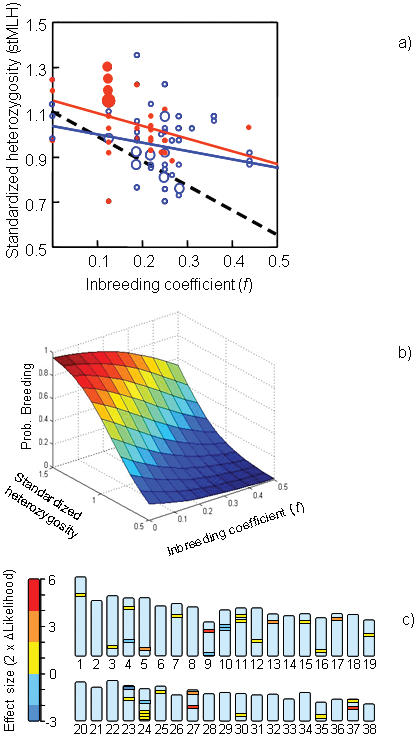
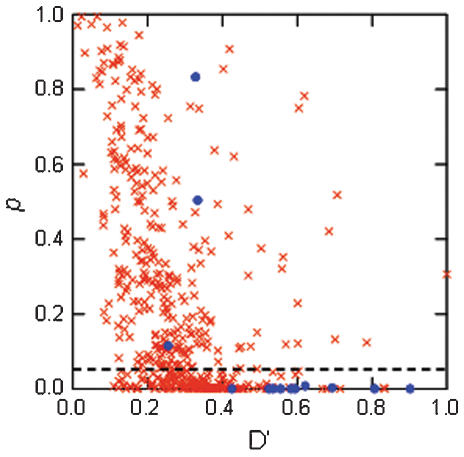
Recent analyses have questioned the usefulness of heterozygosity estimates as measures of the inbreeding coefficient (f), a finding that may have dramatic consequences for the management of endangered populations. We confirm that f and heterozygosity is poorly correlated in a wild and highly inbred wolf population. Yet, our data show that for each level of f, it was the most heterozygous wolves that established themselves as breeders, a selection process that seems to have decelerated the loss of heterozygosity in the population despite a steady increase of f. The markers contributing to the positive relationship between heterozygosity and breeding success were found to be located on different chromosomes, but there was a substantial amount of linkage disequilibrium in the population, indicating that the markers are reflecting heterozygosity over relatively wide genomic regions. Following our results we recommend that management programs of endangered populations include estimates of both f and heterozygosity, as they may contribute with complementary information about population viability.


Conflict of interest statement

Competing Interests: The authors have declared that no competing interests exist.

Figures

Figure 1
Figure 1. Demographic and genetic data for the Scandinavian wolf population between 1991 and 2002 averaged over two-year periods.
a) mean number of wolves and b) mean (±s.e.m.) inbreeding coefficients (blue) and standardized heterozygosity (red). The number of genotyped wolves (n) per group of years is indicted above the X-axis. Both inbreeding coefficients (F 5,82 = 5.95, P<0.001) and standardized heterozygosity (F 5,82 = 4.97, P<0.001) show significant differences among the groups of years.
Figure 2
Figure 2. Reproductive status and inbreeding coefficients of Scandinavian wolves in relation to heterozygosity and chromosomal location of 31 microsatellite loci.
a) The relationship between inbreeding coefficient (f) and standardized heterozygosity (stMLH). Individuals that recruited to the breeding population (filled red circles, solid red regression line) exhibited higher stMLH than those that did not enter the breeding population (open blue circles, solid blue regression line) (ANCOVA: inbreeding coefficient, F 1,82 = 7.96, P = 0.006; breeding recruitment success, F 1,82 = 7.43, p = 0.008). The stippled black line shows the expected relationship between f and stMLH. b) Breeding probability against inbreeding coefficient (f) and stMLH based on model estimates from a logistic regression analysis (f, β = −5.84, p = 0.06; stMLH, β = 4.87, p = 0.017). Relative to the population mean values of f (0.207) and stMLH (1.0), an increase of 1 SD in f corresponds to a 32% reduction in breeding probability, and a decrease of 1 SD in stMLH corresponds to a 40% reduction in breeding probability c) The effects of heterozygosity on the recruitment success of wolves for each of the 31 microsatellite markers and their locations on the autosomal chromosomes in the dog genome. The statistical effect is measured as two-times the likelihood difference between the model with the marker and the null model; positive values (yellow-red) indicate positive associations, negative values (blue) negative associations.
Figure 3
Figure 3. Simulated mean heterozygosity of 100.000 offspring from 2068 pairs of wolves regressed on the mean heterozygosity of the parents.
The filled blue circles represent the simulated heterozygosity of offspring from nine actual pairs in the Scandinavian wolf population. The regression slope is 0.241 and r2 is 0.057.
Figure 4
Figure 4. Linkage disequilibrium between pair-wise microsatellite loci in Scandinavian wolves.
D′- and p-values are shown for locus-pairs located on the same (dots) and different (crosses) chromosomes. The dashed line indicates the p = 0.05 significance level.

References

    1. Hedrick PW. Conservation genetics: where are we now? Trends Ecol Evol. 2001;16:629–636.
    1. Gilpin ME, Soulé ME. In: Conservation Biology: the science of scarcity and diversity, Soulé ME, editor. (Sinauer Associates); 1986. pp. 19–34.
    1. Garner A, Rachlow JL, Hicks JF. Patterns of genetic diversity and its loss in mammalian populations. Conservation Biology. 2005;19:1215–1221.
    1. Keller LF, Waller DM. Inbreeding effects in wild populations. Trends Ecol Evol. 2002;17:230–241.
    1. Pemberton J. Measuring inbreeding depression in the wild: the old ways are the best. Trends Ecol Evol. 2004;19:613–615. - PubMed

Publication types