. 2006 Dec 21:3:13.
doi: 10.1186/1743-8454-3-13.

Choroid plexus epithelial monolayers--a cell culture model from porcine brain

Affiliations

Choroid plexus epithelial monolayers--a cell culture model from porcine brain

Carsten Baehr et al. Cerebrospinal Fluid Res. .

Abstract

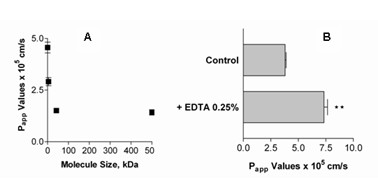
Background: The goal of the present study was to develop an in vitro choroid plexus (CP) epithelial cell culture model for studying transport of protein-mediated drug secretion from blood to cerebrospinal fluid (CSF) and vice versa.

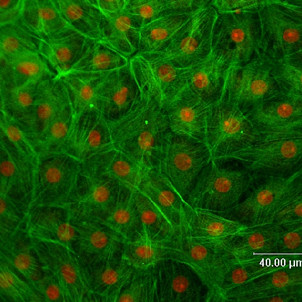
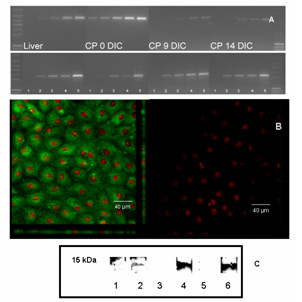
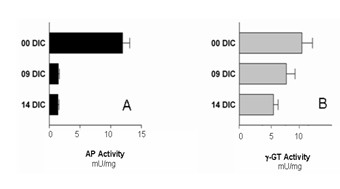
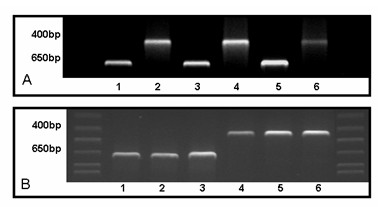
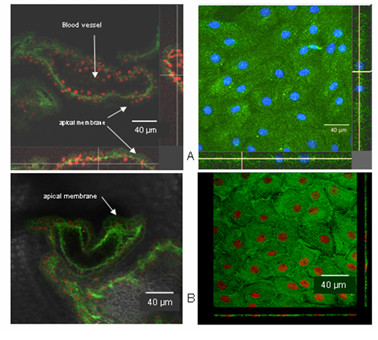
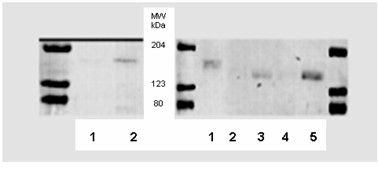
Methods: Cells were isolated by mechanical and enzymatic treatment of freshly isolated porcine plexus tissue. Epithelial cell monolayers were grown and CSF secretion and transepithelial resistance were determined. The expression of f-actin as well as the choroid plexus marker protein transthyretin (TTR), were assessed. The expression of the export proteins p-glycoprotein (Pgp, Abcb1) and multidrug resistance protein 1 (Mrp1, Abcc1) was studied by RT-PCR, Western-blot and immunofluorescence techniques and their functional activity was assessed by transport and uptake experiments.

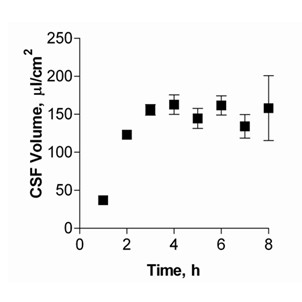
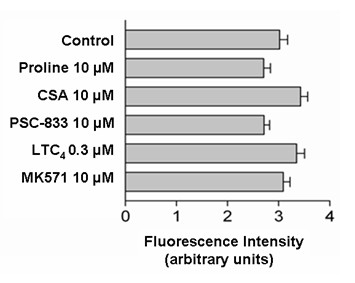
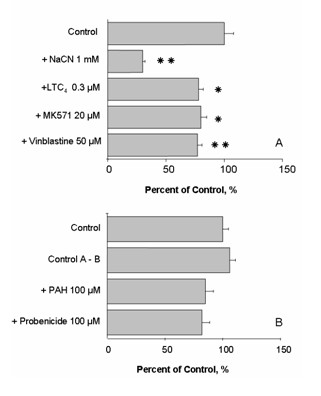
Results: Choroid plexus epithelial cells were isolated in high purity and grown to form confluent monolayers. Filter-grown monolayers displayed transendothelial resistance (TEER) values in the range of 100 to 150 ohms cm2. Morphologically, the cells showed the typical net work of f-actin and expressed TTR at a high rate. The cultured cells were able to secrete CSF at a rate of 48.2 +/- 4.6 microl/cm2/h over 2-3 hours. The ABC-export protein Mrp1 was expressed in the basolateral (blood-facing) membranes of cell monolayers and intact tissue. P-glycoprotein showed only low expression within the apical (CSF directed) membrane but was located more in sub-apical cell compartments. This finding was paralleled by the lack of directed excretion of p-glycoprotein substrates, verapamil and rhodamine 123.

Conclusion: It was demonstrated that CP epithelium can be isolated and cultured, with cells growing into intact monolayers, fully differentiating and with properties resembling the tissue in vivo. Thus, the established primary porcine CP model, allowing investigation of complex transport processes, can be used as a reliable tool for analysis of xenobiotic transport across the blood-cerebrospinal fluid barrier (BCSFB).


Figures

Figure 1
Figure 1
FITC-Phalloidin-stained porcine choroid plexus epithelial cells monolayer after 14 days cell culture (stained f-actin in green, propidium iodide-stained cell nuclei in red).
Figure 2
Figure 2
A) Amplified cDNA of liver (control), fresh CP, CP 9 DIC, and 14 DIC in an ethidium bromide gel. TTR amplifies as 371 bp (top row), β-actin, used as internal standard amplifies at 703 bp (bottom row). For each sample, lanes 1 through 5 show amplification results for 15 to 35 cycles, with lanes corresponding to PCR products with 5 cycles of additional amplification (lane 1, 15; lanne 2,20, lane 3,25; lanne 4,30; lane 5, 35). B) Confocal images of choroid plexus epithelial cell monolayer 14 DIC. On the left, TTR is shown in green after incubation of the cells with anti-TTR and secondary antibody. Cell nuclei are shown in red (propidium iodide staining). No TTR staining was seen in control images (right side), when cells were incubated with secondary antibody only. C) TTR Western blot of liver (lanes 1 and 2), freshly isolated CP (lanes 3 and 4) and choroid plexus epithelial cells 14 DIC (lanes 5 and 6). Samples without primary antibody served as controls (lanes 1, 3 and 5).
Figure 3
Figure 3
Alkaline phosphatase (A) and γ-glutamyl-transferase (B) activity in freshly isolated choroid plexus epithelial cells and cells 9 DIC and 14 DIC (means ± SEM, n = 6).
Figure 4
Figure 4
Choroid plexus epithelial cell secretion volumes after 14 DIC. Measurements were taken every hour up to 8 h (means ± SEM, n = 6).
Figure 5
Figure 5
A) Apparent permeability coefficients of 5-carboxyfluorescein and dextrans 0.4 kDa to 500 kDa (means ± SEM, n = 6). B) Permeability of 5-carboxyfluorescein without and with open tight junctions by the addition of EDTA (means ± SEM, n = 6).
Figure 6
Figure 6
A) RT-PCR of Pgp (468 bp) and β-actin (703 bp); from left to right: liver (lanes 1 and 2), fresh CP tissue (lanes 3 and 4) and CPEC 14 DIC (lanes 5 and 6). B) RT-PCR of Mrp1 (436 bp) and β-actin (703 bp) in CPEC 14 DIC (lanes 1 and 4), fresh CP tissue (lanes 2 and 5) and liver (lanes 3 and 6).
Figure 7
Figure 7
A) Confocal images of choroid plexus epithelial cell monolayers (right side) and freshly isolated intact tissue (left side). Pgp (immunostaining shown in green) is localized sub-apical (intracellular) rather than in apical membranes. B) Immunostaining of Mrp1 in 14 day-old cell monolayers (right side) and freshly isolated intact tissue (left side). Immunostaining (green) occurs predominantly in the abluminal (basolateral) side.
Figure 8
Figure 8
Western blot of Mrp1 (left side; primary antibody MRPR1) and Pgp (right side; primary antibody: Alexis C219). Left side: lane 1, apical CP membranes; lane 2, basolateral CP membranes; Right side: lane 1, brain capillary endothelial cells (20 μg); lane 2, basolateral choroid plexus epithelial cells membranes (10 μg); lane 3, apical membrane (10 μg); lane 4, basolateral membrane (25 μg); lane 5, apical membrane (25 μg).
Figure 9
Figure 9
Uptake of 2 μM rhodamine 123 without (control) and with substrates of ABC-transport proteins. None of the compounds showed a significant effect on uptake of the Pgp substrate rhodamine 123 (CSA = cyclosporine A, PSC = PSC-833; LTC4 = leucotriene C4; means ± SEM, n = 6).
Figure 10
Figure 10
A) Transport of fluorescein-methotrexate across cultured choroid plexus epithelial cells (14 DIC) from the apical to the basolateral side in absence and presence of modifiers of organic anion transport expressed as a percentage of control (means ± SEM, n = 6). B) Transport of fluorescein-methotrexate across cultured choroid plexus epithelial cells from the basolateral to the apical side in absence and in presence of modifiers of organic anion transport. None of the compounds showed a significant effect on Fl-MTX permeability (means ± SEM, n = 6).

Similar articles

Cited by

References

    1. Spector R. Drug transport in the mammalian central nervous system: multiple complex systems. A critical analysis and commentary. Pharmacology. 2000;60:58–73. doi: 10.1159/000028349. - DOI - PubMed
    1. Spector R, Johanson CE. The mammalian choroid plexus. Sci Am. 1989;261:68–74. - PubMed
    1. Cserr HF. Physiology of the choroid plexus. Physiol Rev. 1971;51:273–311. - PubMed
    1. Ghersi-Egea JF, Strazielle N. Brain drug delivery, drug metabolism, and multidrug resistance at the choroid plexus. Microsc Res Tech. 2001;52:83–88. doi: 10.1002/1097-0029(20010101)52:1<83::AID-JEMT10>3.0.CO;2-N. - DOI - PubMed
    1. el-Bacha RS, Minn A. Drug metabolizing enzymes in cerebrovascular endothelial cells afford a metabolic protection to the brain. Cell Mol Biol. 1999;45:15–23. - PubMed