

An ecometric analysis of neighbourhood cohesion
- PMID: 17184538
- PMCID: PMC1769397
- DOI: 10.1186/1478-7954-4-17
An ecometric analysis of neighbourhood cohesion
Abstract
Background: It is widely believed that the social environment has an important influence on health, but there is less certainty about how to measure specific factors within the social environment that could link the neighbourhood of residence to a health outcome. The objectives of the study were to examine the underlying constructs captured by an adapted version of Buckner's neighbourhood cohesion scale, and to assess the reliability of the scale at the small-area-level by combining ecometric methodology with ordinal modelling of a five-point scale.
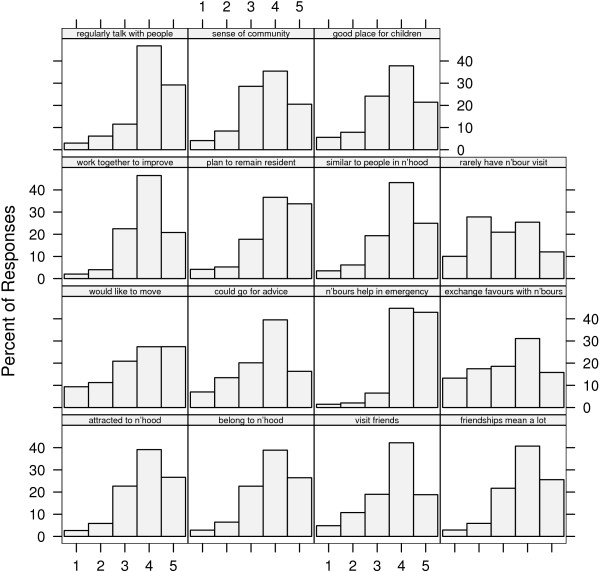
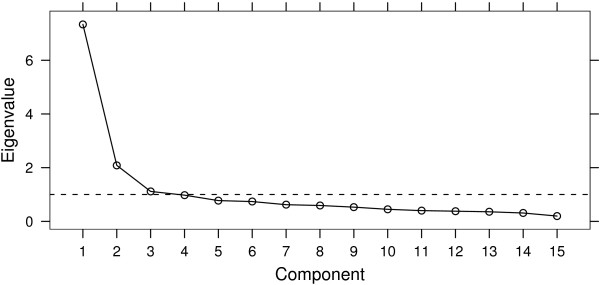
Methods: Data were analysed from 11,078 participants in the Caerphilly Health and Social Needs Study, who were sampled from within 325 UK census enumeration districts in Caerphilly county borough, Wales, UK. The responses of interest came from 15 question items designed to capture different facets of neighbourhood cohesion. Factor analysis was used to identify constructs underlying the neighbourhood cohesion item responses. Using a multilevel ecometric model, the variability present in these ordinal responses was decomposed into contextual, compositional, item-level and residual components.
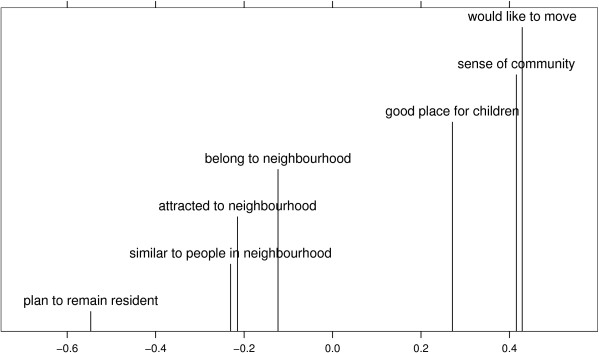
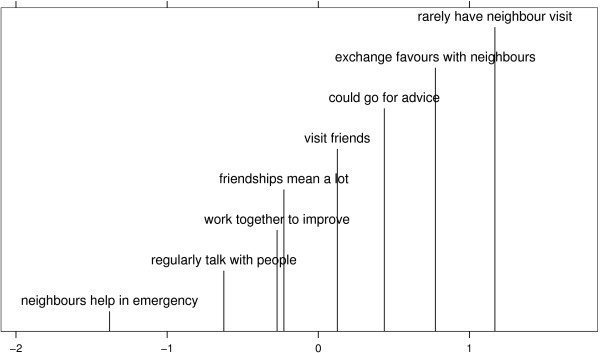
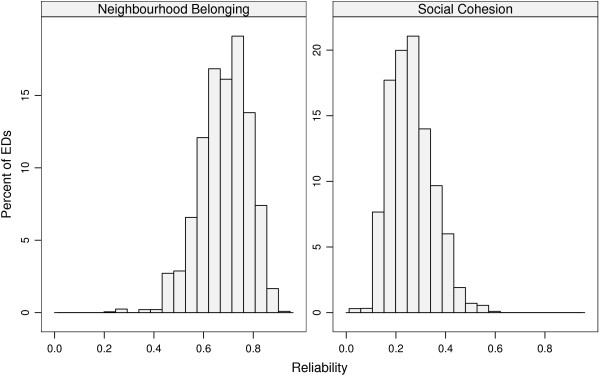
Results: Two constructs labelled neighbourhood belonging and social cohesion were identified, and variability in both constructs was modelled at each level of the multilevel structure. The intra-neighbourhood correlations were 6.4% and 1.0% for the neighbourhood belonging and social cohesion subscales, respectively. Given the large sample size, contextual neighbourhood cohesion scores can be estimated reliably. The wide variation in the observed frequency of occurence of the scale item activities suggests that the two subscales have desirable ecometric properties. Further, the majority of between-neighbourhood variation is not explained by the socio-demographic characteristics of the individual respondents.
Conclusion: Assessment of the properties of the adapted neighbourhood cohesion scale using factor analysis and ecometric analysis extended to an ordinal scale has shown that the items allow fine discrimination between individuals. However, large sample sizes are needed in order to accurately estimate contextual neighbourhood cohesion. The scale is therefore appropriate for use in the measurement of neighbourhood cohesion at small-area-level in future studies of neighbourhoods and health.
Figures
Similar articles
-
The challenges of measuring social cohesion in public health research: A systematic review and ecometric meta-analysis.SSM Popul Health. 2022 Jan 21;17:101028. doi: 10.1016/j.ssmph.2022.101028. eCollection 2022 Mar. SSM Popul Health. 2022. PMID: 35111897 Free PMC article. Review.
-
Neighbourhood social capital: measurement issues and associations with health outcomes.Obes Rev. 2016 Jan;17 Suppl 1:96-107. doi: 10.1111/obr.12373. Obes Rev. 2016. PMID: 26879117
-
Perceptions of the neighbourhood environment and self rated health: a multilevel analysis of the Caerphilly Health and Social Needs Study.BMC Public Health. 2007 Oct 9;7:285. doi: 10.1186/1471-2458-7-285. BMC Public Health. 2007. PMID: 17925028 Free PMC article.
-
Does social cohesion modify the association between area income deprivation and mental health? A multilevel analysis.Int J Epidemiol. 2007 Apr;36(2):338-45. doi: 10.1093/ije/dym004. Epub 2007 Feb 28. Int J Epidemiol. 2007. PMID: 17329315
-
A brief conceptual tutorial on multilevel analysis in social epidemiology: interpreting neighbourhood differences and the effect of neighbourhood characteristics on individual health.J Epidemiol Community Health. 2005 Dec;59(12):1022-8. doi: 10.1136/jech.2004.028035. J Epidemiol Community Health. 2005. PMID: 16286487 Free PMC article. Review.
Cited by
-
The communities first (ComFi) study: protocol for a prospective controlled quasi-experimental study to evaluate the impact of area-wide regeneration on mental health and social cohesion in deprived communities.BMJ Open. 2014 Oct 14;4(10):e006530. doi: 10.1136/bmjopen-2014-006530. BMJ Open. 2014. PMID: 25314962 Free PMC article. Clinical Trial.
-
Neighborhood social cohesion, religious participation and sexual risk behaviors among cisgender black sexual minority men in the southern United States.Soc Sci Med. 2021 Jun;279:113913. doi: 10.1016/j.socscimed.2021.113913. Epub 2021 May 13. Soc Sci Med. 2021. PMID: 33991789 Free PMC article.
-
The challenges of measuring social cohesion in public health research: A systematic review and ecometric meta-analysis.SSM Popul Health. 2022 Jan 21;17:101028. doi: 10.1016/j.ssmph.2022.101028. eCollection 2022 Mar. SSM Popul Health. 2022. PMID: 35111897 Free PMC article. Review.
-
Does the longitudinal association between neighbourhood cohesion and mental health differ by ethnicity? Results from the UK Household Longitudinal Survey.Soc Psychiatry Psychiatr Epidemiol. 2022 Apr;57(4):859-872. doi: 10.1007/s00127-021-02125-6. Epub 2021 Jul 9. Soc Psychiatry Psychiatr Epidemiol. 2022. PMID: 34241637
-
From sociocultural disintegration to community connectedness dimensions of local community concepts and their effects on psychological health of its residents.Psychiatry J. 2013;2013:872146. doi: 10.1155/2013/872146. Epub 2013 Jun 4. Psychiatry J. 2013. PMID: 24236288 Free PMC article. Review.
References
-
- Sampson R, Morenoff J, Gannon-Rowley T. Assessing "neighborhood effects": Social processes and new directions in research. Annu Rev Sociol. 2002;28:443–478. doi: 10.1146/annurev.soc.28.110601.141114. - DOI
-
- Putnam RD. Making democracy work: civic traditions in modern Italy. Princeton, NJ: Princeton University Press; 1993. p. 167.
-
- Kawachi I, Berkman L. Social Cohesion, Social Capital, and Health. In: Kawachi I, Berkman L, editor. Social Epidemiology. New York: Oxford University Press; 2000. pp. 174–177.
LinkOut - more resources
Full Text Sources
