. 2006;7(12):R123.
doi: 10.1186/gb-2006-7-12-r123.

Three-dimensional morphology and gene expression in the Drosophila blastoderm at cellular resolution I: data acquisition pipeline

Affiliations

Three-dimensional morphology and gene expression in the Drosophila blastoderm at cellular resolution I: data acquisition pipeline

Cris L Luengo Hendriks et al. Genome Biol. 2006.

Abstract

Background: To model and thoroughly understand animal transcription networks, it is essential to derive accurate spatial and temporal descriptions of developing gene expression patterns with cellular resolution.

Results: Here we describe a suite of methods that provide the first quantitative three-dimensional description of gene expression and morphology at cellular resolution in whole embryos. A database containing information derived from 1,282 embryos is released that describes the mRNA expression of 22 genes at multiple time points in the Drosophila blastoderm. We demonstrate that our methods are sufficiently accurate to detect previously undescribed features of morphology and gene expression. The cellular blastoderm is shown to have an intricate morphology of nuclear density patterns and apical/basal displacements that correlate with later well-known morphological features. Pair rule gene expression stripes, generally considered to specify patterning only along the anterior/posterior body axis, are shown to have complex changes in stripe location, stripe curvature, and expression level along the dorsal/ventral axis. Pair rule genes are also found to not always maintain the same register to each other.

Conclusion: The application of these quantitative methods to other developmental systems will likely reveal many other previously unknown features and provide a more rigorous understanding of developmental regulatory networks.


Figures

Figure 1
Figure 1
The BDTNP's three-dimensional gene expression analysis pipeline. The major steps of the pipeline are shown. Blue arrows show the path of the major workflow as materials or data files are passed between each step. Black arrows indicate metadata describing experimental details of each step being captured in BID or being retrieved from BID during image analysis, feature extraction, and visualization.
Figure 2
Figure 2
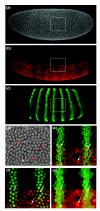
Comparing three-dimensional raw images to PointCloud representations. (a-c) Maximum projections of the three channels of a three-dimensional embryo image; (a) the nuclear stain (white); (b) a snail mRNA stain (red); and (c) an eve mRNA stain (green). Note the small bright speckles visible in all three channels at the same locations. These are outside the cytoplasm and are detected and removed by our image analysis algorithms. The small white rectangles show a region of interest that is displayed in (d-g). (d,e) The raw image of the nuclear stain (d) and the mRNA stains for eve and sna (e). (f,g) Two different renderings of the PointCloud derived from this image made using our visualization tool PointCloudXplore: (f) uses small spheres whose volumes are proportional to the measured volumes of the corresponding nuclei; (g) uses a Voronoi tessellation of the coordinates in the PointCloud. The arrows indicate the locations of the same three cells in each of the panels (d-g).
Figure 3
Figure 3
Comparing segmentation results on the top and the side. Using a maximum projection, we show two portions of a three-dimensional image of an embryo fluorescently stained to label nuclei. (a) A projection along the optical axis, yielding a x-y image (the top of the embryo); (b) a projection perpendicular to that, yielding a x-z image (the side of the embryo). The nuclei on the top of the embryo appear well separated and distinct (a). Seen from the side, however, individual nuclei appear elongated along the z-axis due to limited axial resolution, which makes them more difficult to identify (b). The segmentation algorithm provided an accurate segmentation of nuclei (c) on the tops of embryo images, but (d) on the sides, a model was used to fine-tune the segmentation, resulting in a less accurate result.
Figure 4
Figure 4
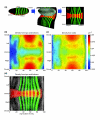
Stage 5 blastoderm embryos show a complex pattern of nuclear densities. (a) A schematic representation of how information calculated on the three-dimensional surface constructed from a PointCloud was projected onto a surrounding cylinder and the cylinder was then unrolled to produce a planar map. In these cylindrical projections, anterior is to the left, posterior to the right, the dorsal midline is at the top and bottom, and the ventral midline is in the middle. The distance along the a/p axis is given as a percent egg length (EL). (b-d) Average local nuclear density maps were computed from 294 embryos. The maps in (b,d) were computed from the 'top' and 'bottom' portions of each embryo image only, where the segmentation is most accurate. The map (c) was computed from the 'sides' only. The two maps broadly agree, but on the sides of the embryo images the segmentation algorithm has underestimated the number of nuclei dorsally and overestimated the number ventrally. Isodensity curves were plotted over a color map representing local average densities from 0.025 nuclei/μm2 (dark blue) to 0.05 nuclei/μm2 (dark red) (b,c). The average expression patterns of eve (green) and snail (red) are shown with the isodensity contour (d). The most anterior stripe of eve follows a ridge of locally high density, and the boundaries of snail expression follow contour lines along about half the length of the embryo.
Figure 5
Figure 5
Patterns of nuclear displacement from the PointCloud surface. The location of each nucleus with respect to a smooth PointCloud surface was mapped and averaged over the same cohort of embryos used in Figure 3 and displayed as a cylindrical projection. The map shows that the average apical (positive) or basal (negative) shift of nuclei forms a pattern that appears to correlate with cell fate and the expression patterns of blastoderm transcriptional regulators. Egg length (EL).
Figure 6
Figure 6
Locations of stripes of the pair rule genes ftz, eve and prd. The locations of stripe borders along the a/p axis were computed at 16 locations around each embryo; the measurements for all embryos were averaged. The results are displayed as orthographic projections in which the anterior of the embryo is to the left and the dorsal midline to the top. Pair-wise comparisons of the expression of (a) eve and ftz and (b) eve and prd are shown. The error bars give the 95% confidence intervals for the means. The relationship between eve and ftz stripes was constant, but prd stripes shifted their registration relative to eve's along both the a/p and d/v axes. The data for eve expression were derived from n = 215 embryos at stage 5:50-100%, ftz from n = 155, and prd from n = 17. Egg length (EL).
Figure 7
Figure 7
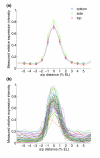
Expression intensity profiles taken from embryos imaged in different orientations. (a) The average intensity profile measured on the image bottom (blue), side (green) or top (red) with respect to the orientation of the embryo in the microscope. Intensities for eve stripe 1 were measured within two strips 1/16th of the width of the embryo circumference located on the left and right lateral midlines, after normalizing the expression values by setting the 1st percentile of the values in the whole embryo to 0 and the 99th percentile to 1. The plot shows the average intensity along the a/p axis for these strips. The difference in height between the three graphs gives an indication of the orientation-specific error. The measured intensity differs by less than 10% when the embryo surface is perpendicular or parallel to the optical axis. (b) An indication of the variation between individual PointClouds; the 52 profiles used to obtain the top average profile in (a).
Figure 8
Figure 8
Methods for quantifying relative protein and mRNA levels give similar results. Average expression of kni mRNA at the beginning of stage 5 (7 embryos) is compared to kni protein expression at mid-stage 5 (17 embryos). The two graphs show the expression along the a/p axis (x-axis) at the ventral (top graph) and dorsal (bottom graph) midlines. The levels of fluorescence for mRNA labeling and protein labeling have remarkably similar shapes. Egg length (EL).
Figure 9
Figure 9
The relative levels of pair rule stripe expression vary between and along stripes. Plotted are averaged expression intensities of gene stripes for (a-c) ftz, (d) eve, (e) prd and (f) slp1. The various stripes of each gene show marked differences in expression profiles and each gene has a unique mode of variation in the direction of the d/v axis. The error bars give the 95% confidence intervals for the means. The data for eve expression were derived from n = 215 embryos at stage 5:50-100%, ftz from n = 155, prd from n = 17, and slp1 from n = 23.
Figure 10
Figure 10
The boundaries of relative levels of ftz expression. Plotted are the averaged locations of various threshold levels of ftz expression derived from 155 embryos, computed and displayed similarly as in Figure 6. For example, those cells expressing ftz above 75% of the maximum level of expression are shown in red. Note the shape of the stripes above the 50% threshold is similar to that given by the inflection points (Figure 6), but not equal. For example, the dorsal-most point of stripe 7 is less than 50% of the maximum expression level for more than half the embryos (that is, the stripe at that point is not shown in this graph). Egg length (EL).
Figure 11
Figure 11
Overview of the segmentation algorithm. The main steps of the algorithm are illustrated here on a small portion of a slice through the middle of an embryo. Note that the actual images are three-dimensional and comprise a whole embryo. The DNA image is the input Sytox channel. A shell mask defines the region that contains all the information of interest for the segmentation algorithm: the blastoderm nuclei with a small part of the cytoplasm. The DNA mask distinguishes the nuclei from the background (cytoplasm, yolk, and so on). The seeds image contains the local maxima of the smoothed DNA, a Gaussian filtered version of DNA image. Surface normals are computed for each seed from the shell, and used to prune the seeds. The image nuclei is the nuclear segmentation mask, dividing the DNA mask into individual nuclei. The dotted arrow going back to the pruned seeds represents the addition of seeds according to the results obtained in nuclei. The apical cytoplasm and basal cytoplasm mark the cytoplasmic regions for each nucleus estimated using a tessellation.
Figure 12
Figure 12
Sytox attenuation with depth. Relative intensity of the Sytox stain within each nucleus, plotted against the depth of the nucleus along the optical axis. Sytox levels were normalized by scaling the 99th percentile of intensity to 100.
Figure 13
Figure 13
BID schema. Each table corresponds to a step in the experimental process. The tables have been grouped into four blocks corresponding to a coarser subdivision of the pipeline.

Similar articles

Cited by

References

    1. Minden JS, Agard DA, Sedat JW, Alberts BM. Direct cell lineage analysis in Drosophila melanogaster by time-lapse, three-dimensional optical microscopy of living embryos. J Cell Biol. 1989;109:505–516. - PMC - PubMed
    1. Burne RM, Bard JB, Dubreuil C, Guest E, Hill W, Kaufman M, Stark M, Davidson D, Baldock RA. A three-dimensional model of the mouse at embryonic day 9. Dev Biol. 1999;216:457–468. - PubMed
    1. Lieb JD, de Solórzano CO, Rodriguez EG, Jones A, Angelo M, Lockett S, Meyer BJ. The Caenorhabditis elegans dosage compensation machinery is recruited to X chromosome DNA attached to an autosome. Genetics. 2000;156:1603–1621. - PMC - PubMed
    1. Kumar S, Jayaraman K, Panchanathan S, Gurunathan R, Marti-Subirana A, Newfield SJ. BEST: A novel computational approach for comparing gene expression patterns from early stages of Drosophila melanogaster development. Genetics. 2002;162:2037–2047. - PMC - PubMed
    1. Megason SG, Fraser SE. Digitizing life at the level of the cell: high-performance laser-scanning microscopy and image analysis for in toto imaging of development. Mechanisms Dev. 2003;120:1407–1420. - PubMed

Publication types