

NADH hyperoxidation correlates with enhanced susceptibility of aged rats to hypoxia
- PMID: 17184883
- PMCID: PMC3341851
- DOI: 10.1016/j.neurobiolaging.2006.11.006
NADH hyperoxidation correlates with enhanced susceptibility of aged rats to hypoxia
Abstract
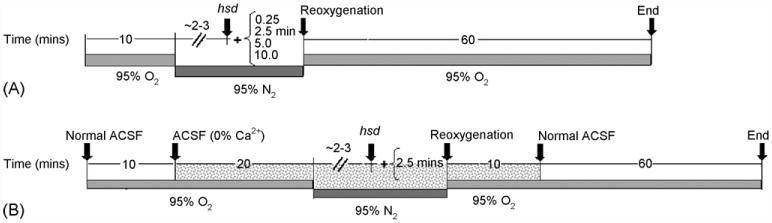
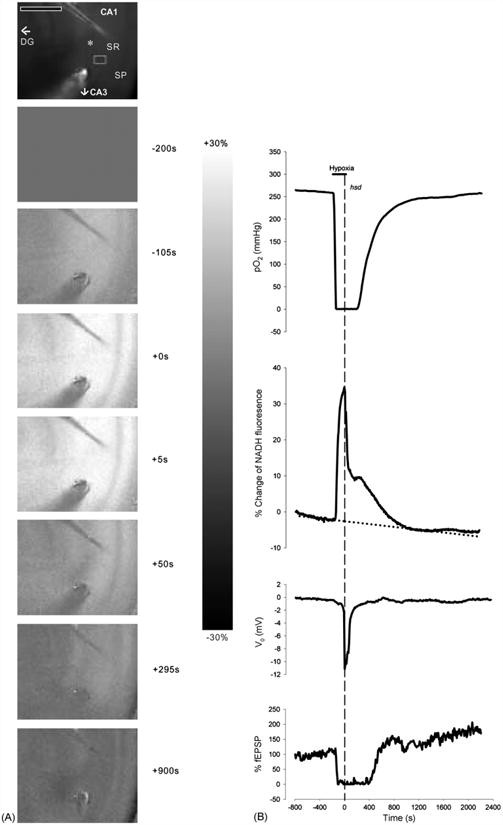
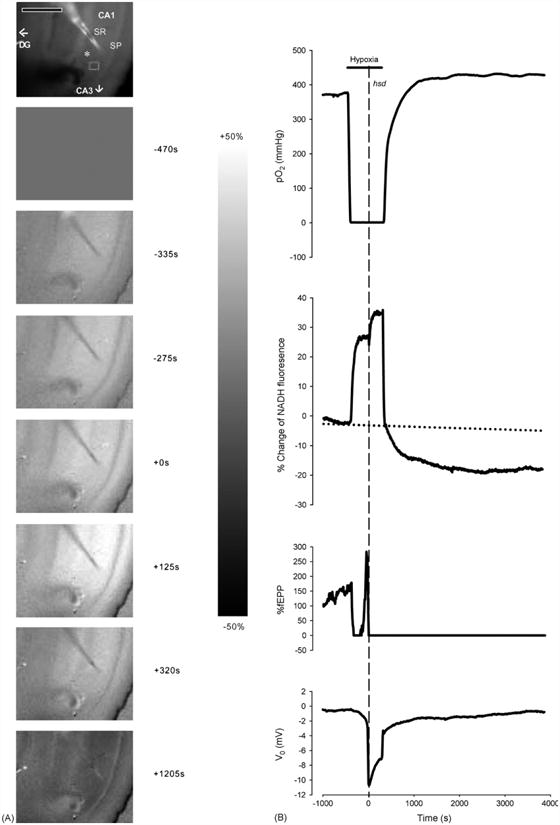
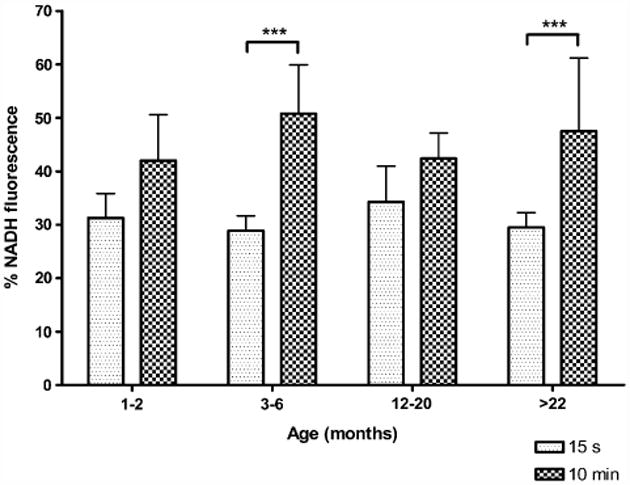
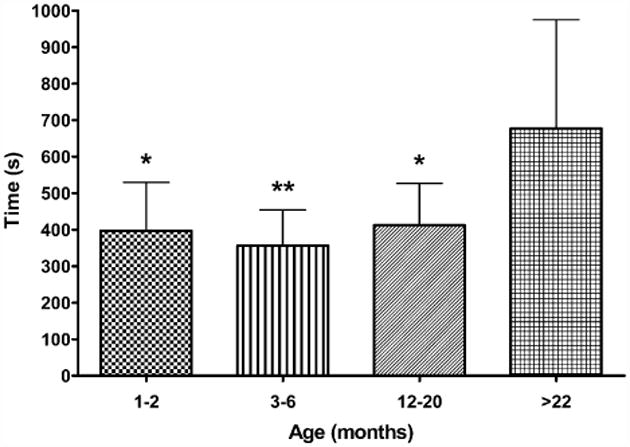
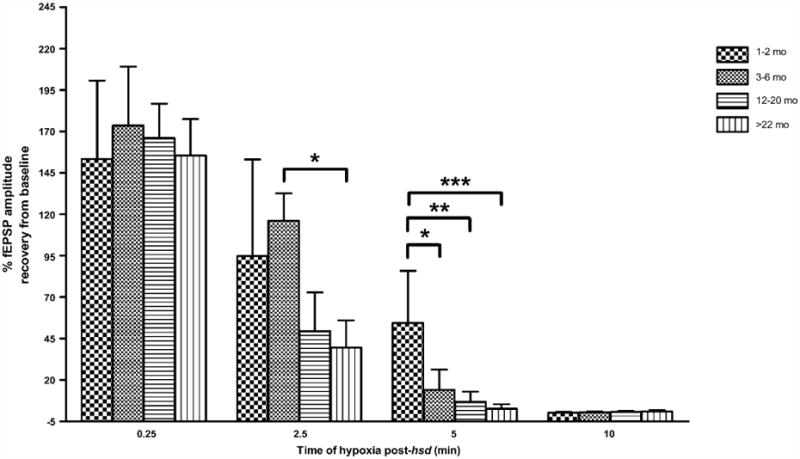
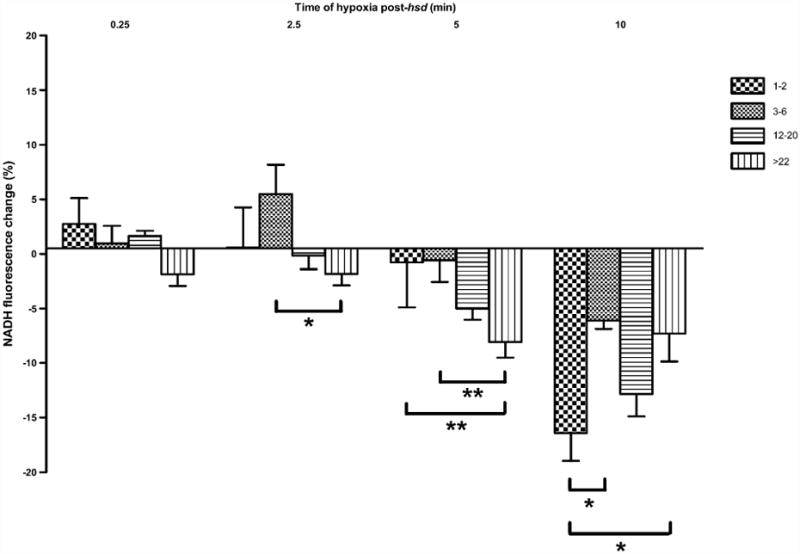
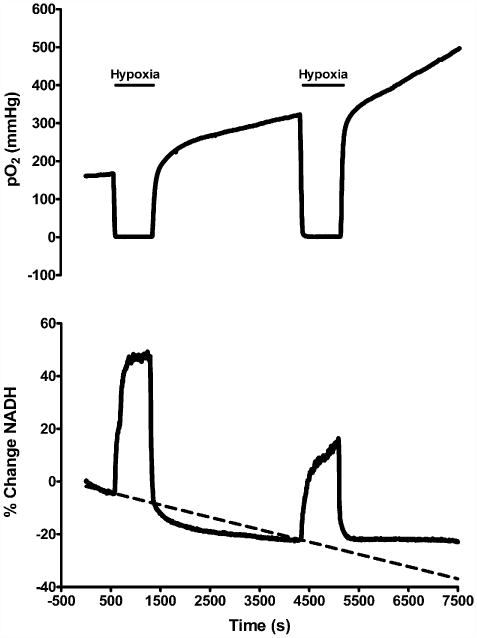
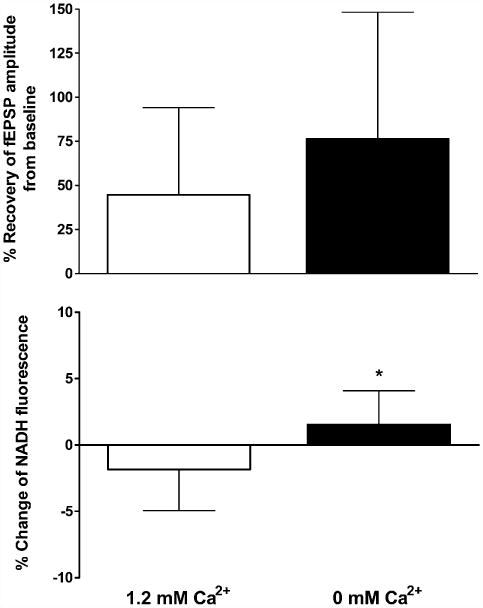
Aging increases mitochondrial dysfunction and susceptibility to hypoxia. Previous reports have indicated an association between post-hypoxic hyperoxidation of intra-mitochondrial enzymes and delayed neuronal injury. Therefore we investigated the relationship between NADH fluorescence and neuronal function during and after hypoxia across the lifespan. Hippocampal slices were prepared from adult (1 to >22 months) F344 rats. NADH fluorescence, extracellular voltage and tissue PO(2) were recorded from the CA1 region during hypoxia (95% N(2)) of various lengths following onset of hypoxic spreading depression (hsd). Slices from younger rats recovered evoked neuronal responses to a greater degree and exhibited less hyperoxidation after a hypoxic episode, than slices from older rats. However, the use of Ca(2+) free-media in slices from >22 month old rats improved recovery and delayed NADH hyperoxidation (2.5 min hypoxia after hsd). Post-hypoxic decrease of NADH fluorescence (hyperoxidation) was age dependent and correlated with decreased neuronal recovery. Slices exposed to repeated hypoxic episodes yielded data suggesting depletion of the NAD(+) pool, which may have contributed to the deterioration of neuronal function.
Conflict of interest statement
Figures
Similar articles
-
Nicotinamide pre-treatment ameliorates NAD(H) hyperoxidation and improves neuronal function after severe hypoxia.Neurobiol Dis. 2014 Feb;62:469-78. doi: 10.1016/j.nbd.2013.10.025. Epub 2013 Oct 31. Neurobiol Dis. 2014. PMID: 24184921 Free PMC article.
-
Interaction between tissue oxygen tension and NADH imaging during synaptic stimulation and hypoxia in rat hippocampal slices.Neuroscience. 2005;132(3):645-57. doi: 10.1016/j.neuroscience.2005.01.040. Neuroscience. 2005. PMID: 15837126
-
Age-related metabolic fatigue during low glucose conditions in rat hippocampus.Neurobiol Aging. 2015 Feb;36(2):982-92. doi: 10.1016/j.neurobiolaging.2014.09.016. Epub 2014 Sep 28. Neurobiol Aging. 2015. PMID: 25443286 Free PMC article.
-
Calcium influx from the extracellular space promotes NADH hyperoxidation and electrical dysfunction after anoxia in hippocampal slices.J Cereb Blood Flow Metab. 1998 Feb;18(2):215-21. doi: 10.1097/00004647-199802000-00013. J Cereb Blood Flow Metab. 1998. PMID: 9469165
-
Prolonged anoxic depolarization exacerbates NADH hyperoxidation and promotes poor electrical recovery after anoxia in hippocampal slices.Brain Res. 1998 Mar 9;786(1-2):165-70. doi: 10.1016/s0006-8993(97)01438-8. Brain Res. 1998. PMID: 9554996
Cited by
-
Neuronal calcium homeostasis and dysregulation.Antioxid Redox Signal. 2011 Apr 1;14(7):1261-73. doi: 10.1089/ars.2010.3386. Epub 2010 Nov 30. Antioxid Redox Signal. 2011. PMID: 20626318 Free PMC article. Review.
-
The Unfolded Protein Response: A Double-Edged Sword for Brain Health.Antioxidants (Basel). 2023 Aug 21;12(8):1648. doi: 10.3390/antiox12081648. Antioxidants (Basel). 2023. PMID: 37627643 Free PMC article. Review.
-
Contrasting Metabolic Insufficiency in Aging and Dementia.Aging Dis. 2021 Jul 1;12(4):1081-1096. doi: 10.14336/AD.2021.0104. eCollection 2021 Jul. Aging Dis. 2021. PMID: 34221551 Free PMC article. Review.
-
Old age increases microglial senescence, exacerbates secondary neuroinflammation, and worsens neurological outcomes after acute traumatic brain injury in mice.Neurobiol Aging. 2019 May;77:194-206. doi: 10.1016/j.neurobiolaging.2019.02.010. Epub 2019 Feb 20. Neurobiol Aging. 2019. PMID: 30904769 Free PMC article.
-
Effects of relative hypoglycemia on LTP and NADH imaging in rat hippocampal slices.Brain Res. 2007 Aug 24;1165:30-9. doi: 10.1016/j.brainres.2007.06.052. Epub 2007 Jul 24. Brain Res. 2007. PMID: 17651706 Free PMC article.
References
-
- Amagasa M, Ogawa A, Yoshimoto T. Effects of calcium and calcium antagonists against deprivation of glucose and oxygen in guinea pig hippocampal slices. Brain Res. 1990;526(1):1–7. - PubMed
-
- Ames BN, Shigenaga MK, Hagen TM. Mitochondrial decay in aging. Biochim Biophys Acta. 1995;1271(1):165–170. - PubMed
-
- Bahar S, Fayuk D, Somjen GG, Aitken PG, Turner DA. Mitochondrial and intrinsic optical signals imaged during hypoxia and spreading depression in rat hippocampal slices. J Neurophysiol. 2000;84(1):311–324. - PubMed
-
- Balestrino M, Aitken PG, Somjen GG. Spreading depression-like hypoxic depolarization in CA1 and fascia dentata of hippocampal slices: relationship to selective vulnerability. Brain Res. 1989;497(1):102–107. - PubMed
Publication types
MeSH terms
Substances
Grants and funding
LinkOut - more resources
Full Text Sources
Medical
Miscellaneous
