. 2007 Apr 15;580(Pt. 2):523-41.
doi: 10.1113/jphysiol.2006.126128. Epub 2006 Dec 21.

Voltage-dependent calcium channels of dog basilar artery

Affiliations

Voltage-dependent calcium channels of dog basilar artery

Elena Nikitina et al. J Physiol. .

Abstract

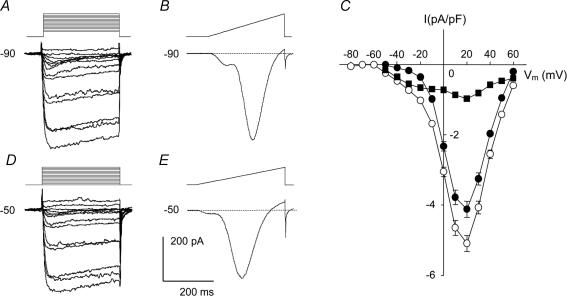
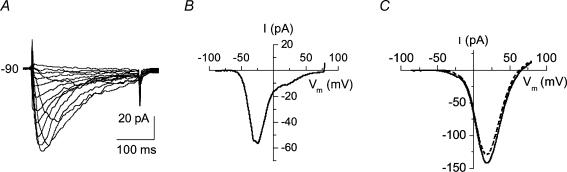
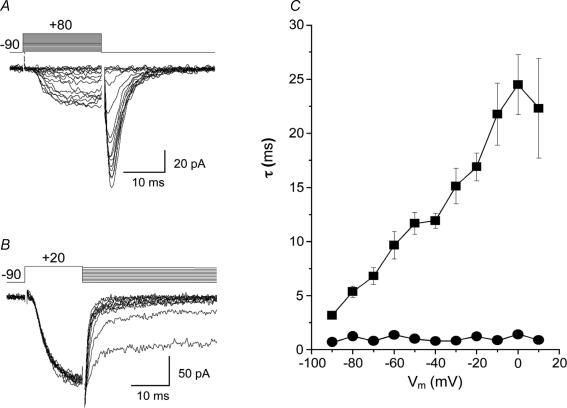
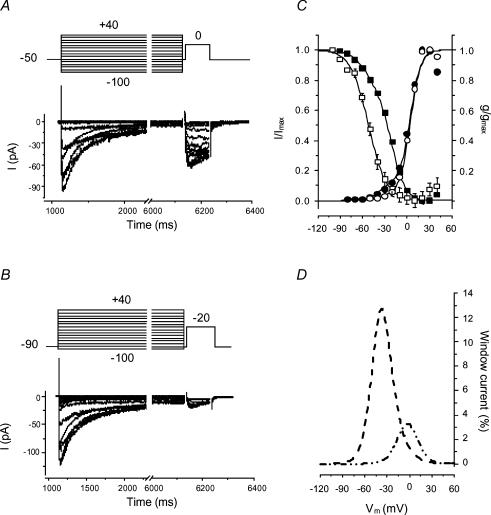
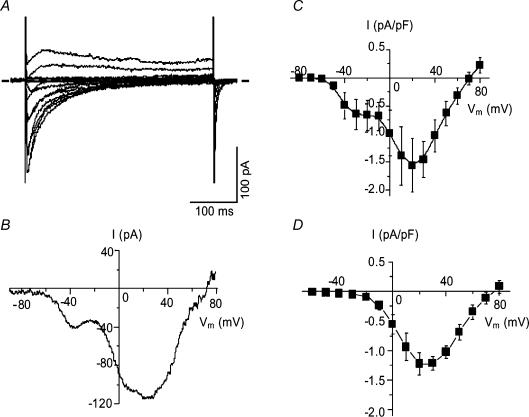
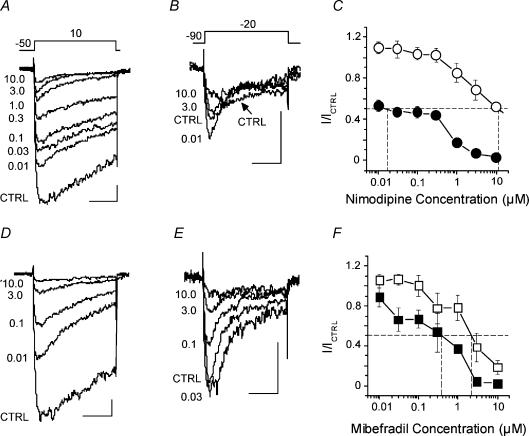
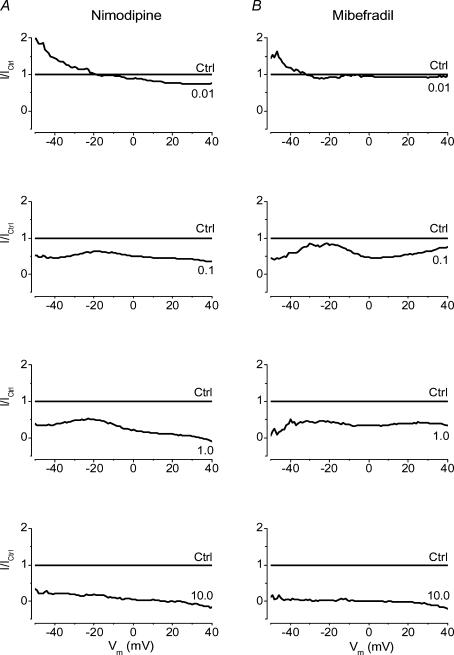
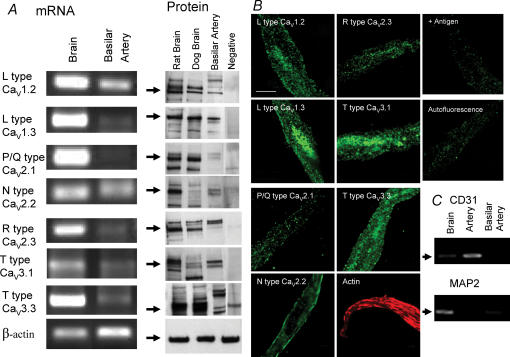
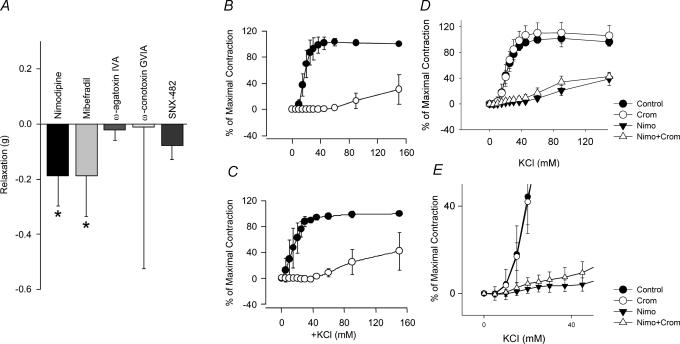
Electrophysiological and molecular characteristics of voltage-dependent calcium (Ca(2+)) channels were studied using whole-cell patch clamp, polymerase chain reaction and Western blotting in smooth muscle cells freshly isolated from dog basilar artery. Inward currents evoked by depolarizing steps from a holding potential of -50 or -90 mV in 10 mm barium consisted of low- (LVA) and high-voltage activated (HVA) components. LVA current comprised more than half of total current in 24 (12%) of 203 cells and less than 10% of total current in 52 (26%) cells. The remaining cells (127 cells, 62%) had LVA currents between one tenth and one half of total current. LVA current was rapidly inactivating, slowly deactivating, inhibited by high doses of nimodipine and mibefradil (> 0.3 microM), not affected by omega-agatoxin GVIA (gamma100 nM), omega-conotoxin IVA (1 microM) or SNX-482 (200 nM) and probably carried by T-type Ca(2+) channels based on the presence of messenger ribonucleic acid (mRNA) and protein for Ca(v3.1) and Ca(v3.3) alpha(1) subunits of these channels. LVA currents exhibited window current with a maximum of 13% of the LVA current at -37.4 mV. HVA current was slowly inactivating and rapidly deactivating. It was inhibited by nimodipine (IC(50) = 0.018 microM), mibefradil (IC(50) = 0.39 microM) and omega-conotoxin IV (1 microM). Smooth muscle cells also contained mRNA and protein for L- (Ca(v1.2) and Ca(v1.3)), N- (Ca(v2.2)) and T-type (Ca(v3.1) and Ca(v3.3)) alpha(1) Ca(2+) channel subunits. Confocal microscopy showed Ca(v1.2) and Ca(v1.3) (L-type), Ca(v2.2) (N-type) and Ca(v3.1) and Ca(v3.3) (T-type) protein in smooth muscle cells. Relaxation of intact arteries under isometric tension in vitro to nimodipine (1 microM) and mibefradil (1 microM) but not to omega-agatoxin GVIA (100 nM), omega-conotoxin IVA (1 microM) or SNX-482 (1 microM) confirmed the functional significance of L- and T-type voltage-dependent Ca(2+) channel subtypes but not N-type. These results show that dog basilar artery smooth muscle cells express functional voltage-dependent Ca(2+) channels of multiple types.


Figures

Figure 1
Figure 1. Voltage-dependent Ba2+ currents in normal dog basilar artery smooth muscle cells
A, B, D and E, representative examples of the most commonly found current traces recorded from single cells held at –90 mV and –50 mV. The voltage protocol is shown above each of these recordings. All 4 recordings were made from the same cell, were highly filtered for presentation purposes and are shown with the same time and current scale for comparison. C, summary I–V plots of data obtained by running step voltage protocols in 199 cells from 17 dogs held at –90 mV (○) and 207 cells from 17 dogs held at –50 mV (•). Peak inward currents were normalized to cell capacitance, averaged and plotted against step voltage (values are means ± s.e.m.). ▪, the difference current obtained by subtracting the previous 2 I–V curves. Error bars are omitted for clarity if they were completely enveloped in the symbols. Vm is membrane potential.
Figure 2
Figure 2. Normal dog basilar artery smooth muscle cells are diverse in terms of proportion of LVA and HVA currents
A, family of current traces obtained in one cell showing almost complete absence of HVA current. B, ramp tracing from the same cell from a holding potential of –90 mV. C, superimposed ramp current traces from one cell held at –90 (continuous line) and –50 mV (dotted line) plotted as current–voltage relation showing an example of virtually complete absence of the LVA current component. The difference in peak amplitudes of these 2 recordings might be attributed to different degrees of Ca2+ channel inactivation caused by difference in steepness/velocity of voltage changes of protocols employed and different initial holding potentials.
Figure 3
Figure 3. Tail currents in dog basilar artery smooth muscle cells
A, representative recordings of tail currents obtained by running the step voltage protocol shown above the traces with a test pulse duration of 50 ms. B, voltage dependence of Ca2+ channel deactivation was revealed from tail currents evoked by a 20 ms test voltage pulse from –90 mV to +20 mV to evoke maximal IBa with subsequent return to different potentials (–90 to +10 mV in 10 mV increments). C, the decline of tail currents was described by a double exponential function. Averaged values of time constants (τ) obtained from such fitting and plotted against after-pulse potentials showed quite different behaviour. The smaller τ was voltage independent (•) while larger τ showed linear voltage dependency (▪) with a slope factor of 0.23 s V−1 (n=14 cells from 4 dogs).
Figure 4
Figure 4. Activation–inactivation characteristics of HVA and LVA components of IBa and window currents in dog basilar artery smooth muscle cells
A and B, typical series of current traces obtained from a single cell by stepping to 0 mV (A) or –20 mV (B) for 100 ms following application of a series of 5 s conditioning potentials from –100 mV to +40 mV in 10 mV increments with a 5 ms interpulse (upper parts of panels show schematics of voltage protocols). C, summary data demonstrating the voltage dependence of IBa inactivation (squares) and activation (circles). ▪, total availability of Ca2+ channels (n=42 from 4 dogs) and the curve is the fit to a double Boltzmann equation. □, availability of LVA channels fitted to single Boltzmann equation (n=35 from 4 dogs). Voltage dependence of activation was derived from data shown in Fig. 1. •, total inward current from a holding potential of –90 mV; and ○, HVA current from a holding potential of –50 mV. Both sets of data were fitted to double Boltzmann equations with curves showing the fits. D, the LVA and HVA components of mathematical activation and inactivation models were normalized to their maximal amplitudes and multiplied in pairs giving percentile I–V curves for window currents through LVA (dashed line) and HVA (dash–double dot line) channels.
Figure 5
Figure 5. Voltage-dependent Ca2+ channel currents in normal dog basilar artery smooth muscle cells
A, Ca2+ current traces recorded from the cell held at –50 mV. B, current recorded from the same cell in response to ramp pulse from –90 to +80 mV. C and D, current–voltage relationships from step protocol data at holding potentials of –90 mV (C) and –50 mV (D) averaged from 5 cells.
Figure 6
Figure 6. Nimodipine and mibefradil antagonism of voltage-dependent Ca2+ channel currents in freshly isolated dog basilar artery myocytes
A and B, representative current recordings obtained from one cell by applying voltage protocols shown above traces (in mV) before (CTRL) and after addition of different concentrations (0.01–10 μm) of nimodipine to the bath solution. C, averaged dose–response curves from experiments in A and B (n=20 cells from 7 dogs). The points of intersection of the experimental curves with the dashed line at y=0.5 give estimates of IC50 for LVA (○) and HVA (•) Ca2+ currents. D and E, representative current traces obtained from another smooth muscle cell in the absence (CTRL) and presence of mibefradil (0.01–10 μm). F, mibefradil dose–response curves for LVA (□) and HVA (▪) Ca2+ channel currents (n=13 cells from 7 dogs). The intersection of the experimental curves with the dashed line at y=0.5 gives estimates of IC50 for LVA (□) and HVA (▪) Ca2+ currents. Scale indicators in A, B, D and E are 50 ms (horizontal) and 20 pA (vertical).
Figure 7
Figure 7. Analysis of current–voltage relationships for Ca2+ channel currents in dog basilar artery smooth muscle cells under cumulative block by nimodipine (A) or mibefradil (B)
Each curve of the upper panels represents current–voltage relationships for ramp protocol data from a holding potential of –90 mV obtained in the absence (CTRL) or presence of nimodipine (0.01–10 μm (concentration indicated on the curve in each panel), n=20 cells from 7 dogs) or mibefradil (0.01–10 μm, n=13 cells from 7 dogs). Data were analysed by first averaging the original data points for each mV. Each smoothed I–V curve then was normalized to its peak current. Normalized data for groups were averaged (bottom row) and divided point by point by the control data (dashed curve). This yielded a line at y=1 (CTRL in the upper row of panels) representing the I–V data in the absence of any antagonist. The curves of different shapes and positions represent I–V data recorded at the marked concentrations of nimodipine or mibefradil.
Figure 8
Figure 8. Messenger RNA and protein for Ca2+ channel α1 subunits detected in dog basilar artery smooth muscle cells
A, PCR products from mRNA amplification of isolated basilar artery smooth muscle cells detected mRNA for L- (Cav1.2 and Cav1.3), N- (Cav2.2) and T-type (Cav3.1, Cav3.3) Ca2+ channel α1 subunits but not P/Q- (Cav2.1) and R- (Cav2.3) subunits. Western blotting showed protein for L- (Cav1.2 and Cav1.3), N- (Cav2.2) and T-type (Cav3.1, Cav3.3) Ca2+ channel α1 subunits. B, confocal microscopy of isolated smooth muscle cells was consistent with Western blotting, demonstrating positive staining for L- (Cav1.2 and Cav1.3), N- (Cav2.2) and T-type (Cav3.1, Cav3.3) but not P/Q- or R-type Ca2+ channel α1 subunits (scale bar, 50 μm). +Antigen is control example of loss of staining for Cav1.2 when antibody was added with immunizing antigen. Autofluorescence also is shown. C, cells studied were smooth muscle cells not contaminated by endothelial cells or neurons as shown by negative PCR for CD31 and MAP2.
Figure 9
Figure 9. Isometric tension recordings showing function of Ca2+ channel subtypes in dog basilar artery
A, relaxation of basilar artery from baseline tension occurred in response to mibefradil (10 μm) and nimodipine (1 μm, P < 0.05 for both) but not to ω-agatoxin IVA (0.4 μm), ω-conotoxin GVIA (2 μm) or SNX-482 (0.2 μm). KCl concentration–contraction curves in absence (•) or presence (○) of nimodipine (B, 1 μm) and mibefradil (C, 10 μm) show significant inhibition of contraction by both drugs. D, KCl concentration–contraction curves in absence or presence of nimodipine (Nimo, 1 μm) or cromakalim (Crom, 5 μm) shows a small component of contraction at low concentrations of KCl not inhibited by nimodipine in the presence of cromakalim (E, n=4–5 rings from 2 dogs for all experiments).

Similar articles

Cited by

References

    1. Aaronson PI, Bolton TB, Lang RJ, MacKenzie I. Calcium currents in single isolated smooth muscle cells from the rabbit ear artery in normal-calcium and high-barium solutions. J Physiol. 1988;405:57–75. - PMC - PubMed
    1. Alborch E, Salom JB, Torregrosa G. Calcium channels in cerebral arteries. Pharmacol Ther. 1995;68:1–34. - PubMed
    1. Alderton JM, Steinhardt RA. Calcium influx through calcium leak channels is responsible for the elevated levels of calcium-dependent proteolysis in dystrophic myotubes. J Biol Chem. 2000;275:9452–9460. - PubMed
    1. Avdonin PV, Buhler FR, Tkachuk VA. Ca2+-agonistic effect of a T-type Ca-channel blocker mibefradil (Ro40-5967) Membr Cell Biol. 2000;13:645–655. - PubMed
    1. Avery RB, Johnston D. Multiple channel types contribute to the low-voltage-activated calcium current in hippocampal CA3 pyramidal neurons. J Neurosci. 1996;16:5567–5582. - PMC - PubMed

Publication types