

Ethanol prevents development of destructive arthritis
- PMID: 17185416
- PMCID: PMC1765445
- DOI: 10.1073/pnas.0608620104
Ethanol prevents development of destructive arthritis
Abstract
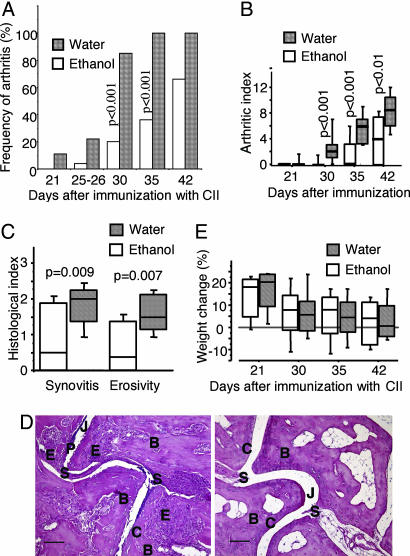
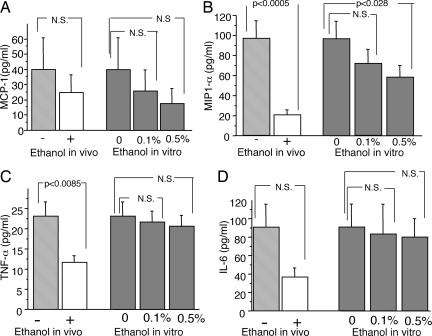
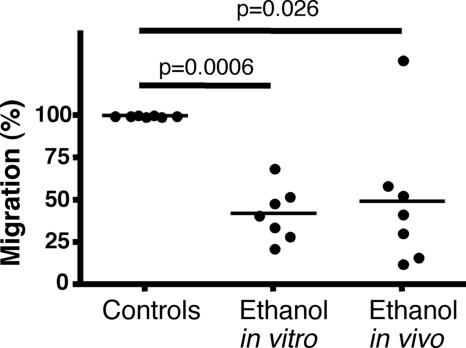
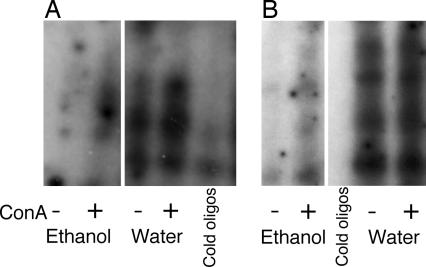
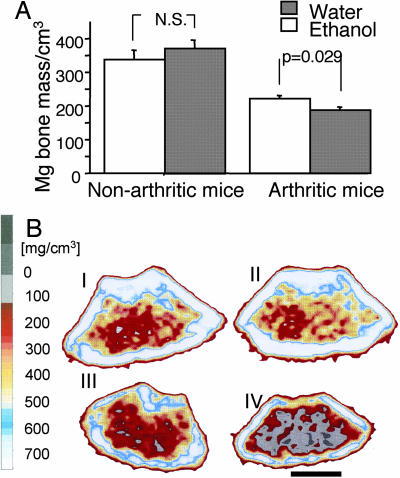
Environmental factors are thought to play a major role in the development of rheumatoid arthritis. Because the use of ethanol is widespread, we assessed the role of ethanol intake on the propensity to develop chronic arthritis. Collagen type II-immunized mice were given water or water containing 10% (vol/vol) ethanol or its metabolite acetaldehyde. Their development of arthritis was assessed, as well as the impact of ethanol on leukocyte migration and activation of intracellular transcription factors. Mice exposed daily to this dose of ethanol did not display any liver toxicity, and the development of erosive arthritis was almost totally abrogated. In contrast, the antibody-mediated effector phase of collagen-induced arthritis was not influenced by ethanol exposure. Also, the major ethanol metabolite, acetaldehyde, prevented the development of arthritis. This antiinflammatory and antidestructive property of ethanol was mediated by (i) down-regulation of leukocyte migration and (ii) up-regulation of testosterone secretion, with the latter leading to decreased NF-kappaB activation. We conclude that low but persistent ethanol consumption delays the onset and halts the progression of collagen-induced arthritis by interaction with innate immune responsiveness.
Conflict of interest statement
The authors declare no conflict of interest.
Figures
Similar articles
-
Down-regulation of Th1-mediated pathology in experimental arthritis by stimulation of the Th2 arm of the immune response.Arthritis Rheum. 2003 Mar;48(3):839-45. doi: 10.1002/art.10832. Arthritis Rheum. 2003. PMID: 12632440
-
Gallium nitrate ameliorates type II collagen-induced arthritis in mice.Int Immunopharmacol. 2014 May;20(1):269-75. doi: 10.1016/j.intimp.2014.03.005. Epub 2014 Mar 19. Int Immunopharmacol. 2014. PMID: 24656780
-
Blockade of interleukin-6 receptor enhances the anti-arthritic effect of glucocorticoids without decreasing bone mineral density in mice with collagen-induced arthritis.Clin Exp Immunol. 2015 Nov;182(2):154-61. doi: 10.1111/cei.12685. Epub 2015 Aug 31. Clin Exp Immunol. 2015. PMID: 26201536 Free PMC article.
-
Antigen-induced, tolerogenic CD11c+,CD11b+ dendritic cells are abundant in Peyer's patches during the induction of oral tolerance to type II collagen and suppress experimental collagen-induced arthritis.Arthritis Rheum. 2006 Mar;54(3):887-98. doi: 10.1002/art.21647. Arthritis Rheum. 2006. PMID: 16508971
-
Acceleration of the onset of collagen-induced arthritis by a deficiency of platelet endothelial cell adhesion molecule 1.Arthritis Rheum. 2003 Nov;48(11):3280-90. doi: 10.1002/art.11268. Arthritis Rheum. 2003. PMID: 14613294
Cited by
-
Interplay of Environmental, Individual and Genetic Factors in Rheumatoid Arthritis Provocation.Int J Mol Sci. 2022 Jul 23;23(15):8140. doi: 10.3390/ijms23158140. Int J Mol Sci. 2022. PMID: 35897715 Free PMC article. Review.
-
Synergistic effects of ethanol and isopentenyl pyrophosphate on expansion of γδ T cells in synovial fluid from patients with arthritis.PLoS One. 2014 Aug 4;9(8):e103683. doi: 10.1371/journal.pone.0103683. eCollection 2014. PLoS One. 2014. PMID: 25090614 Free PMC article.
-
Protective effect of HO-1 transfection against ethanol-induced osteoblast damage.J Huazhong Univ Sci Technolog Med Sci. 2015 Jun;35(3):374-377. doi: 10.1007/s11596-015-1440-3. Epub 2015 Jun 14. J Huazhong Univ Sci Technolog Med Sci. 2015. PMID: 26072076
-
Chromolaena odorata (L.) R. M. King and H. Robinson Leaves Aqueous Extract Improves the Femoral Head in Ethanol-Induced Osteonecrosis in Rats.Evid Based Complement Alternat Med. 2023 Jun 28;2023:5436771. doi: 10.1155/2023/5436771. eCollection 2023. Evid Based Complement Alternat Med. 2023. PMID: 37416805 Free PMC article.
-
Non-canonical Glucocorticoid Receptor Transactivation of gilz by Alcohol Suppresses Cell Inflammatory Response.Front Immunol. 2017 Jun 7;8:661. doi: 10.3389/fimmu.2017.00661. eCollection 2017. Front Immunol. 2017. PMID: 28638383 Free PMC article.
References
-
- Boe DM, Nelson S, Zhang P, Bagby GJ. J Infect Dis. 2001;184:1134–1142. - PubMed
-
- Bernardo J. Hosp Pract. 1991;26:195–208. - PubMed
-
- Rosa H, Silverio AO, Perini RF, Arruda CB. Am J Gastroenterol. 2000;95:1290–1293. - PubMed
-
- Hutchinson SJ, Bird SM, Goldberg DJ. Clin Gastroenterol Hepatol. 2005;3:1150–1159. - PubMed
-
- Cooper CL, Cameron DW. Clin Infect Dis. 2005;41(Suppl 1):S105–S109. - PubMed
Publication types
MeSH terms
Substances
LinkOut - more resources
Full Text Sources
