. 2007 Jan 2;104(1):105-10.
doi: 10.1073/pnas.0604353104. Epub 2006 Dec 21.

Mapping protein collapse with single-molecule fluorescence and kinetic synchrotron radiation circular dichroism spectroscopy

Affiliations

Mapping protein collapse with single-molecule fluorescence and kinetic synchrotron radiation circular dichroism spectroscopy

Armin Hoffmann et al. Proc Natl Acad Sci U S A. .

Abstract

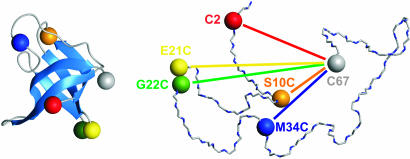
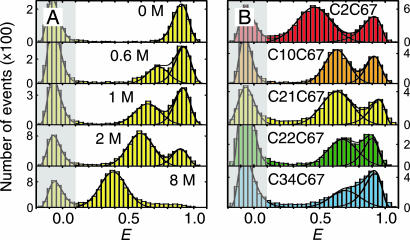
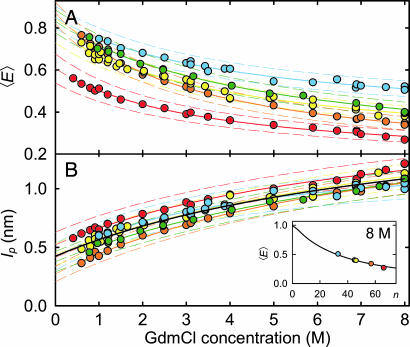
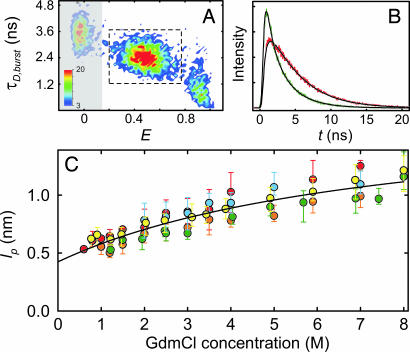
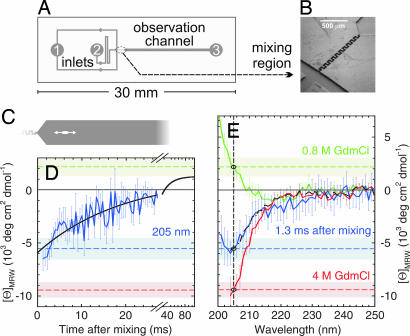
We have used the combination of single-molecule Förster resonance energy transfer and kinetic synchrotron radiation circular dichroism experiments to probe the conformational ensemble of the collapsed unfolded state of the small cold shock protein CspTm under near-native conditions. This regime is physiologically most relevant but difficult to access experimentally, because the equilibrium signal in ensemble experiments is dominated by folded molecules. Here, we avoid this problem in two ways. One is the use of single-molecule Förster resonance energy transfer, which allows the separation of folded and unfolded subpopulations at equilibrium and provides information on long-range intramolecular distance distributions. From experiments with donor and acceptor chromophores placed at different positions within the chain, we find that the distance distributions in unfolded CspTm agree surprisingly well with a Gaussian chain not only at high concentrations of denaturant, where the polypeptide chain is expanded, but also at low denaturant concentrations, where the chain is collapsed. The second, complementary approach is synchrotron radiation circular dichroism spectroscopy of collapsed unfolded molecules transiently populated with a microfluidic device that enables rapid mixing. The results indicate a beta-structure content of the collapsed unfolded state of approximately 20% compared with the folded protein. This suggests that collapse can induce secondary structure in an unfolded state without interfering with long-range distance distributions characteristic of a random coil, which were previously found only for highly expanded unfolded proteins.


Conflict of interest statement

The authors declare no conflict of interest.

Figures

Fig. 1.
Fig. 1.
Schematic of folded (Left) and unfolded (Right) CspTm with the sites for dye attachment for FRET indicated by colored spheres. For every variant investigated, one dye was reacted with Cys at position 67, and a second dye was reacted with a Cys at one of the other positions shown.
Fig. 2.
Fig. 2.
Energy transfer efficiency (E) histograms from single-molecule FRET measurements. (A) Examples from a GdmCl titration of variant C21C67, illustrating unfolded state collapse. See SI Movie 1 for a complete data set of C2C67. (B) Histograms of all variants at 1.5 M GdmCl. The peak at E ≈ 0.9 corresponds to folded molecules, and the peak at intermediate E corresponds to unfolded molecules. The peak at E ≈ 0 (shaded) originates from molecules with an inactive acceptor (26). To determine mean transfer efficiencies, the unfolded peak was fit to a normal distribution, and the other two peaks were fit to log normal functions (black lines) (14). The colors used correspond to those used in Fig. 1.
Fig. 3.
Fig. 3.
Denaturant dependence of the mean transfer efficiencies 〈E〉 and persistence lengths lp. (A) 〈E〉 of the unfolded state of all variants as a function of GdmCl concentration. (B) lp calculated from 〈E〉 using Eqs. 14. (Inset) Shows the measured values of 〈E〉 for all variants at 8 M GdmCl, and as a black line 〈E〉 for a Gaussian chain calculated from Eqs. 14 for lp = 1.1 nm (the mean value of all variants) as a function of sequence separation n (number of peptide bonds excluding linkers). The solid lines in the GdmCl titrations are fits to the empirical equation y = y0 [1 + ΔyKx/(1 + Kx)] used for interpolation; the solid black line is a fit to all data. Estimated error ranges for 〈E〉 and lp are indicated by dashed lines (see SI Materials and Methods). The colors used correspond to those used in Fig. 1.
Fig. 4.
Fig. 4.
Fluorescence lifetime distribution analysis. (A) All events corresponding to unfolded molecules were selected (dashed box) from a two-dimensional histogram (shown is C2C67 at 1.5 M GdmCl) of the number of bursts (color scale) with transfer efficiency E and donor fluorescence lifetime τD,burst. (B) The photons were combined to generate time-correlated single-photon counting histograms for donor (green) and acceptor (red) (see SI Movie 2 for a complete data set of C2C67). (C) The rms end-to-end distance was determined and converted to the apparent persistence length lp (Eq. 4) by using a global fit assuming the distance distribution of a Gaussian chain (black lines). Error bars indicate the uncertainty in the fits. The solid black line in is a fit to all data as described in Fig. 3. The colors used correspond to those used in Fig. 1.
Fig. 5.
Fig. 5.
Secondary structure content of collapsed unfolded CspTm from SRCD. (A) Channel pattern of the microfluidic mixing device. To initiate refolding, unfolded protein injected into inlet 2 is diluted with buffer injected into inlet 1. (B) Rapid mixing occurs in the serpentine-shaped channel shown as a scanning electron micrograph. (C) The synchrotron radiation beam (white ellipse) is positioned in the observation channel. (D) Refolding kinetics of CspTm at 0.8 M GdmCl measured at 205 nm (blue line; error bars give one standard deviation calculated from eight measurements) and a single-exponential fit to the data (solid black line). (E) CD spectrum taken 1.3 ms after mixing (solid blue line), compared with equilibrium spectra under native (solid green line; 0.8 M GdmCl) and unfolding conditions (red line; 4 M GdmCl). The corresponding ellipticities at 205 nm are indicated in the spectra as dashed blue, green, and red lines, respectively. The shaded light blue, green, and red bands indicate one standard deviation from the equilibrium ellipticities of folded and unfolded CspTm, respectively, at 205 nm. The black dashed–dotted curve is a linear combination of the spectra at 0.8 M and 4 M GdmCl used to estimate the secondary structure content of collapsed unfolded CspTm.

References

    1. Jackson SE. Fold Des. 1998;3:R81–R91. - PubMed
    1. Fersht AR. Structure and Mechanism in Protein Sci. New York: Freeman; 1998.
    1. Galzitskaya OV, Finkelstein AV. Proc Natl Acad Sci USA. 1999;96:11299–11304. - PMC - PubMed
    1. Baker D. Nature. 2000;405:39–42. - PubMed
    1. Muñoz V, Eaton WA. Proc Natl Acad Sci USA. 1999;96:11311–11316. - PMC - PubMed

Publication types

MeSH terms

LinkOut - more resources