CBFB-MYH11 hinders early T-cell development and induces massive cell death in the thymus
- PMID: 17185462
- PMCID: PMC1852246
- DOI: 10.1182/blood-2006-10-051508
CBFB-MYH11 hinders early T-cell development and induces massive cell death in the thymus
Abstract
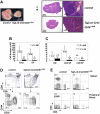
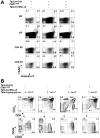
Recent studies suggest that the chromosome 16 inversion, associated with acute myeloid leukemia M4Eo, takes place in hematopoietic stem cells. If this is the case, it is of interest to know the effects of the resulting fusion gene, CBFB-MYH11, on other lineages. Here we studied T-cell development in mice expressing Cbfb-MYH11 and compared them with mice compound-heterozygous for a Cbfb null and a hypomorphic GFP knock-in allele (Cbfb(-/GFP)), which had severe Cbfb deficiency. We found a differentiation block at the DN1 stage of thymocyte development in Cbfb-MYH11 knock-in chimeras. In a conditional knock-in model in which Cbfb-MYH11 expression was activated by Lck-Cre, there was a 10-fold reduction in thymocyte numbers in adult thymus, resulting mainly from impaired survival of CD4+CD8+ thymocytes. Although Cbfb-MYH11 derepressed CD4 expression efficiently in reporter assays, such derepression was less pronounced in vivo. On the other hand, CD4 expression was derepressed and thymocyte development was blocked at DN1 and DN2 stages in E17.5 Cbfb(-/GFP) thymus, with a 20-fold reduction of total thymocyte numbers. Our data suggest that Cbfb-MYH11 suppressed Cbfb in several stages of T-cell development and provide a mechanism for CBFB-MYH11 association with myeloid but not lymphoid leukemia.
Figures


Similar articles
-
Gata2 deficiency delays leukemogenesis while contributing to aggressive leukemia phenotype in Cbfb-MYH11 knockin mice.Leukemia. 2020 Mar;34(3):759-770. doi: 10.1038/s41375-019-0605-7. Epub 2019 Oct 17. Leukemia. 2020. PMID: 31624376 Free PMC article.
-
Role of Cbfb in hematopoiesis and perturbations resulting from expression of the leukemogenic fusion gene Cbfb-MYH11.Blood. 2002 Oct 1;100(7):2449-56. doi: 10.1182/blood-2002-04-1064. Blood. 2002. PMID: 12239155
-
Clinical implications of additional chromosomal abnormalities in adult acute myeloid leukemia with inv (16)/t(16;16)/CBFB::MYH11.Eur J Haematol. 2024 Jun;112(6):964-974. doi: 10.1111/ejh.14192. Epub 2024 Feb 22. Eur J Haematol. 2024. PMID: 38388794
-
Transforming properties of the leukemic inv(16) fusion gene CBFB-MYH11.Curr Top Microbiol Immunol. 1996;211:289-98. doi: 10.1007/978-3-642-85232-9_29. Curr Top Microbiol Immunol. 1996. PMID: 8585960 Review. No abstract available.
-
Function of the inv(16) fusion gene CBFB-MYH11.Curr Opin Hematol. 2001 Jul;8(4):201-5. doi: 10.1097/00062752-200107000-00004. Curr Opin Hematol. 2001. PMID: 11561156 Review.
Cited by
-
Pentraxin 3 deficiency exacerbates lipopolysaccharide-induced inflammation in adipose tissue.Int J Obes (Lond). 2020 Feb;44(2):525-538. doi: 10.1038/s41366-019-0402-4. Epub 2019 Jun 17. Int J Obes (Lond). 2020. PMID: 31209269 Free PMC article.
-
HDAC8 Inhibition Specifically Targets Inv(16) Acute Myeloid Leukemic Stem Cells by Restoring p53 Acetylation.Cell Stem Cell. 2015 Nov 5;17(5):597-610. doi: 10.1016/j.stem.2015.08.004. Epub 2015 Sep 18. Cell Stem Cell. 2015. PMID: 26387755 Free PMC article.
-
CBFβ-SMMHC creates aberrant megakaryocyte-erythroid progenitors prone to leukemia initiation in mice.Blood. 2016 Sep 15;128(11):1503-15. doi: 10.1182/blood-2016-01-693119. Epub 2016 Jul 21. Blood. 2016. PMID: 27443289 Free PMC article.
-
Multiple roles of LncRNA-BMNCR on cell proliferation and apoptosis by targeting miR-145/CBFB axis in BMECs.Vet Q. 2023 Dec;43(1):1-11. doi: 10.1080/01652176.2023.2262525. Epub 2023 Oct 9. Vet Q. 2023. PMID: 37807922 Free PMC article.
-
Core binding factor at the crossroads: determining the fate of the HSC.J Cell Physiol. 2010 Jan;222(1):50-6. doi: 10.1002/jcp.21950. J Cell Physiol. 2010. PMID: 19813271 Free PMC article. Review.
References
-
- Ogawa E, Inuzuka M, Maruyama M, et al. Molecular cloning and characterization of PEBP2 beta, the heterodimeric partner of a novel Drosophila runt-related DNA binding protein PEBP2 alpha. Virology. 1993;194:314–331. - PubMed
-
- Liu P, Tarle SA, Hajra A, et al. Fusion between transcription factor CBF beta/PEBP2 beta and a myosin heavy chain in acute myeloid leukemia. Science. 1993;261:1041–1044. - PubMed
-
- Huang X, Peng JW, Speck NA, Bushweller JH. Solution structure of core binding factor beta and map of the CBF alpha binding site. Nat Struct Biol. 1999;6:624–627. - PubMed
Publication types
MeSH terms
Substances
Grants and funding
LinkOut - more resources
Full Text Sources
Other Literature Sources
Molecular Biology Databases
Research Materials
Miscellaneous

