Lipopolysaccharide opposes the induction of CYP26A1 and CYP26B1 gene expression by retinoic acid in the rat liver in vivo
- PMID: 17185629
- PMCID: PMC3843124
- DOI: 10.1152/ajpgi.00494.2006
Lipopolysaccharide opposes the induction of CYP26A1 and CYP26B1 gene expression by retinoic acid in the rat liver in vivo
Abstract
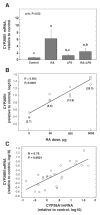
Retinoic acid (RA), a principal metabolite of vitamin A (retinol), is an essential endogenous regulator of gene transcription and an important therapeutic agent. The catabolism of RA must be well regulated to maintain physiological concentrations of RA. The cytochrome P450 (CYP) gene family CYP26, which encodes RA-4-hydroxylase activity, is strongly implicated in the oxidation of RA. Inflammation alters the expression of numerous genes; however, whether inflammation affects CYP26 expression is not well understood. We investigated the regulation of CYP26A1 and CYP26B1 mRNA levels by RA and LPS in the rat liver, as the liver is centrally involved in retinoid metabolism and the acute-phase response to LPS. Both CYP26A1 and CYP26B1 mRNA were induced in <4 h by a single oral dose of all-trans-RA. RA-induced responses of both CYP26A1 and CYP26B1 were significantly attenuated in rats with LPS-induced inflammation whether LPS was given concurrently with RA or after the RA-induced increase in CYP26A1 and CYP26B1 mRNA levels. When RA and LPS were administered simultaneously (6-h study), LPS alone had little effect on either CYP26A1 or CP26B1 mRNA, but LPS reduced by 80% the RA-induced increase in CYP26A1 mRNA (P<0.02), with a similar trend for CYP26B1 mRNA. When LPS was administered 4 h after RA (16-h study), it abrogated the induction of CYP26A1 (P<0.02) and CYP26B1 (P<0.01). Overall, these results suggest that inflammation can potentially disrupt the balance of RA metabolism and maintenance of RA homeostasis, which may possibly affect the expression of other RA-regulated genes.
Figures


Similar articles
-
A comparison of the roles of peroxisome proliferator-activated receptor and retinoic acid receptor on CYP26 regulation.Mol Pharmacol. 2010 Feb;77(2):218-27. doi: 10.1124/mol.109.059071. Epub 2009 Nov 2. Mol Pharmacol. 2010. PMID: 19884280 Free PMC article.
-
Comparison of the function and expression of CYP26A1 and CYP26B1, the two retinoic acid hydroxylases.Biochem Pharmacol. 2012 Jan 1;83(1):149-63. doi: 10.1016/j.bcp.2011.10.007. Epub 2011 Oct 14. Biochem Pharmacol. 2012. PMID: 22020119 Free PMC article.
-
Multiple cytochrome P-450 genes are concomitantly regulated by vitamin A under steady-state conditions and by retinoic acid during hepatic first-pass metabolism.Physiol Genomics. 2011 Jan 7;43(1):57-67. doi: 10.1152/physiolgenomics.00182.2010. Epub 2010 Nov 2. Physiol Genomics. 2011. PMID: 21045116 Free PMC article.
-
Cytochrome P450s in the regulation of cellular retinoic acid metabolism.Annu Rev Nutr. 2011 Aug 21;31:65-87. doi: 10.1146/annurev-nutr-072610-145127. Annu Rev Nutr. 2011. PMID: 21529158 Free PMC article. Review.
-
Retinoid production and catabolism: role of diet in regulating retinol esterification and retinoic Acid oxidation.J Nutr. 2003 Jan;133(1):291S-296S. doi: 10.1093/jn/133.1.291S. J Nutr. 2003. PMID: 12514312 Review.
Cited by
-
Regulating Retinoic Acid Availability during Development and Regeneration: The Role of the CYP26 Enzymes.J Dev Biol. 2020 Mar 5;8(1):6. doi: 10.3390/jdb8010006. J Dev Biol. 2020. PMID: 32151018 Free PMC article. Review.
-
LX-2 Stellate Cells Are a Model System for Investigating the Regulation of Hepatic Vitamin A Metabolism and Respond to Tumor Necrosis Factor α and Interleukin 1β.Drug Metab Dispos. 2024 Apr 16;52(5):442-454. doi: 10.1124/dmd.124.001679. Drug Metab Dispos. 2024. PMID: 38485281 Free PMC article.
-
A comparison of the roles of peroxisome proliferator-activated receptor and retinoic acid receptor on CYP26 regulation.Mol Pharmacol. 2010 Feb;77(2):218-27. doi: 10.1124/mol.109.059071. Epub 2009 Nov 2. Mol Pharmacol. 2010. PMID: 19884280 Free PMC article.
-
Cloning and functional studies of a splice variant of CYP26B1 expressed in vascular cells.PLoS One. 2012;7(5):e36839. doi: 10.1371/journal.pone.0036839. Epub 2012 May 29. PLoS One. 2012. PMID: 22666329 Free PMC article.
-
Inflammation induced by lipopolysaccharide does not prevent the vitamin A and retinoic acid-induced increase in retinyl ester formation in neonatal rat lungs.Br J Nutr. 2013 May 28;109(10):1739-45. doi: 10.1017/S0007114512003790. Epub 2012 Sep 5. Br J Nutr. 2013. PMID: 22950813 Free PMC article.
References
-
- Abu-Abed S, MacLean G, Fraulob V, Chambon P, Petkovich M, Dollé P. Differential expression of the retinoic acid-metabolizing enzymes CYP26A1 and CYP26B1 during murine organogenesis. Mech Dev. 2002;110:173–177. - PubMed
-
- Adamson PC, Balis FM, Smith MA, Murphy RF, Godwin KA, Poplack DG. Dose-dependent pharmacokinetics of all-trans-retinoic acid. J Natl Cancer Inst. 1992;84:1332–1335. - PubMed
-
- Adamson PC, Murphy RF, Godwin KA, Ulm EH, Balis FM. Pharmacokinetics of 9-cis-retinoic acid in the rhesus monkey. Cancer Res. 1995;55:482–485. - PubMed
-
- Altucci L, Gronemeyer H. The promise of retinoids to fight against cancer. Nat Rev. 2001;1:181–193. - PubMed
-
- Balmer JE, Blomhoff R. Gene expression regulation by retinoic acid. J Lipid Res. 2002;43:1773–1808. - PubMed
Publication types
MeSH terms
Substances
Grants and funding
LinkOut - more resources
Full Text Sources

