. 2006 Dec 22:3:104.
doi: 10.1186/1743-422X-3-104.

The role of cholesterol and sphingolipids in chemokine receptor function and HIV-1 envelope glycoprotein-mediated fusion

Affiliations

The role of cholesterol and sphingolipids in chemokine receptor function and HIV-1 envelope glycoprotein-mediated fusion

Sherimay Ablan et al. Virol J. .

Abstract

Background: HIV-1 entry into cells is a multifaceted process involving target cell CD4 and the chemokine receptors, CXCR4 or CCR5. The lipid composition of the host cell plays a significant role in the HIV fusion process as it orchestrates the appropriate disposition of CD4 and co-receptors required for HIV-1 envelope glycoprotein (Env)-mediated fusion. The cell membrane is primarily composed of sphingolipids and cholesterol. The effects of lipid modulation on CD4 disposition in the membrane and their role in HIV-1 entry have extensively been studied. To focus on the role of lipid composition on chemokine receptor function, we have by-passed the CD4 requirement for HIV-1 Env-mediated fusion by using a CD4-independent strain of HIV-1 Env.

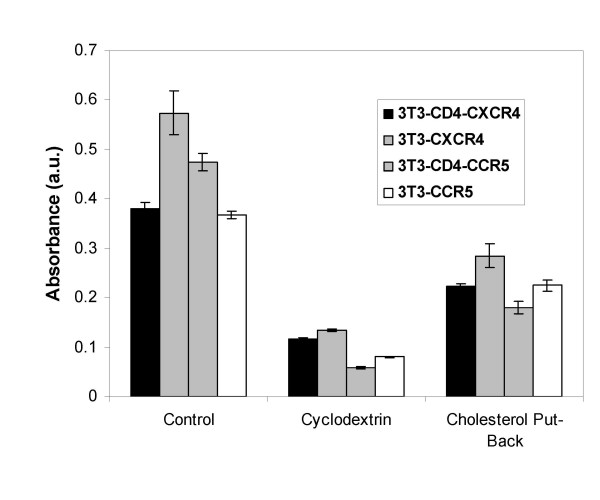
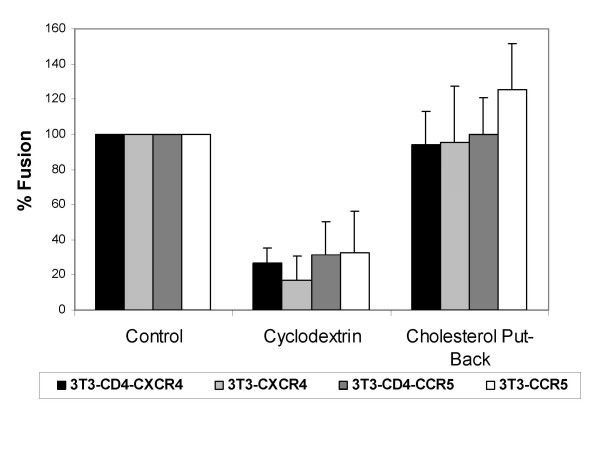
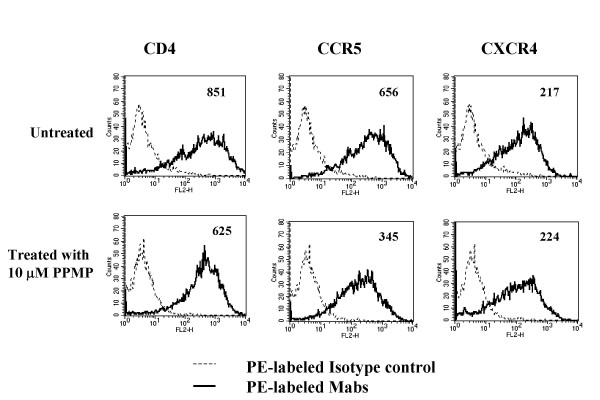
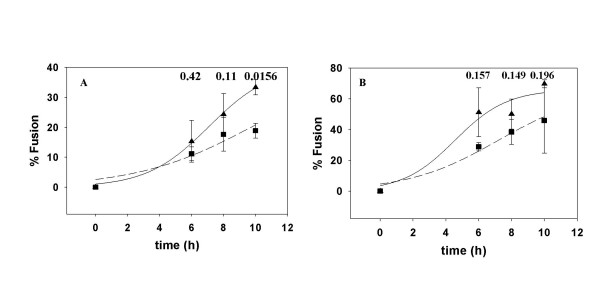
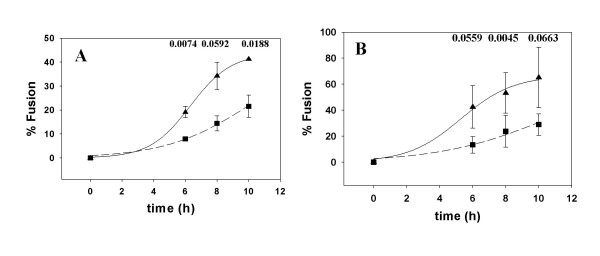
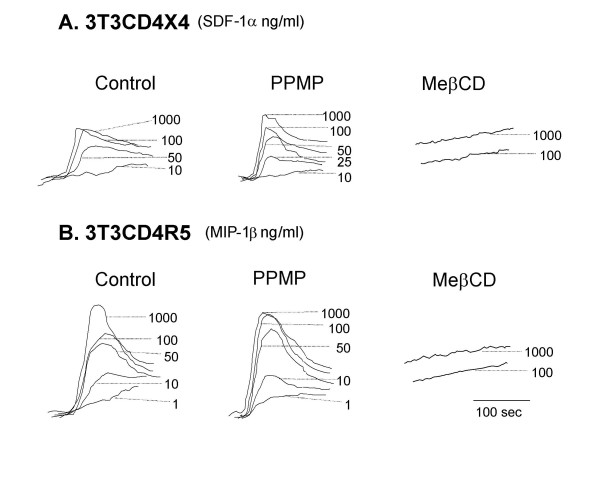
Results: Cell fusion mediated by a CD4-independent strain of HIV-1 Env was monitored by observing dye transfer between Env-expressing cells and NIH3T3 cells bearing CXCR4 or CCR5 in the presence or absence of CD4. Chemokine receptor signaling was assessed by monitoring changes in intracellular [Ca2+] mobilization induced by CCR5 or CXCR4 ligand. To modulate target membrane cholesterol or sphingolipids we used Methyl-beta-cyclodextrin (MbetaCD) or 1-phenyl-2-hexadecanoylamino-3-morpholino-1-propanol (PPMP), respectively. Treatment of the target cells with these agents did not change the levels of CD4 or CXCR4, but reduced levels of CCR5 on the cell surface. Chemokine receptor signalling was inhibited by cholesterol removal but not by treatment with PPMP. HIV-1 Env mediated fusion was inhibited by >50% by cholesterol removal. Overall, PPMP treatment appeared to slow down the rates of CD4-independent HIV-1 Env-mediated Fusion. However, in the case of CXCR4-dependent fusion, the differences between untreated and PPMP-treated cells did not appear to be significant.

Conclusion: Although modulation of cholesterol and sphingolipids has similar effects on CD4-dependent HIV-1 Env-mediated fusion, sphingolipid modulation had little effect on CD4-independent HIV-1 Env-mediated fusion. Chemokine receptor function remained intact following treatment of cells with PPMP. Therefore such treatment may be considered a more suitable agent to inhibit CD4 dependent HIV-1 infection.


Figures

Figure 1
Figure 1
Cholesterol Levels in NIH3T3 cells after MβCD treatment. NIH 3T3 cells were treated with 10 mM MβCD for 30 minutes at 37°C and cholesterol in total cell lysate was determined as described previously [13]. For the put-back experiments the cholesterol-depleted cells were incubated with an MβCD-cholesterol mixture for 60 minutes at 37°C according to [13].
Figure 2
Figure 2
The effect of cholesterol depletion from NIH3T3 Targets on CD4-independent HIV-1 Env-mediated fusion. CMFDA-labeled cells (2 × 10⁵ per well) expressing HIV-18x (black and light gray bars) or HIV-18xV3BAL (dark gray and white bars) Envs were added to the CMTMR-labeled targets expressing cognate co-receptors. The samples were incubated for 6 hrs at 37°C before, after and following cholesterol put-back as described in the legends to Figure 1. Fusion was determined as described in materials and methods.
Figure 3
Figure 3
Effect of PPMP Treatment on CD4 and Co-receptor Expression in NIH3T3 Cells. NIH3T3 target cells on 12 well plates (5 × 10⁴ per well) were cultured in the presence of 10 μM PPMP for 48–72 hours. CD4, CXCR4 and CCR5 levels before and after treatment with PPMP were determined by FACS using PE-conjugated Mabs as described in materials and methods. The numbers in the boxes respresent means of the fluorescence histograms.
Figure 4
Figure 4
Effect of PPMP treatment on HIV-18x Env-mediated Fusion. HIV-18x Env mediated fusion with NIH3T3CXCR4 (A) and NIH3T3CD4 CXCR4 (B) was monitored at different times with untreated (triangles) and PPMP-treated (squares) targets. PPMP treatment and fusion are described in the legends to Figures 3 and 2, respectively. The data were fit to the equation f = a/(1+exp(-(t-t1/2)/b)) using Sigmaplot (SPSS, Chicago), where a is the maximal extent, b represents the rate, and t1/2 is the time at which the half-maximal fusion extent is reached. The curve fitting yielded the following t1/2 values for untreated and PPMP-treated cells, respectively: 7.1 h and 9.8 h (A); 4.6 h and 7.2 h (B). The numbers above the data are p values determined by a paired student t test using Sigmaplot (SPSS, Chicago).
Figure 5
Figure 5
Effect of PPMP treatment on HIV-18xV3BAL Env-mediated Fusion. HIV-18xV3BAL Env mediated fusion with NIH3T3CCR5 (A) and NIH3T3CD4CCR5 (B) was monitored at different times with untreated (triangles) and PPMP-treated (squares) targets. PPMP treatment and fusion are described in the legends to Figures 3 and 2, respectively. The data were fit to the equation f = a/(1+exp(-(t-t1/2)/b)) using Sigmaplot (SPSS, Chicago), where a is the maximal extent, b represents the rate, and t1/2 is the time at which the half-maximal fusion extent is reached. The curve fitting yielded the following t1/2 values for untreated and PPMP-treated cells, respectively: 6.3 h and 10 h (A); 5.3 h and 10.5 h (B) The numbers above the data are p values determined by a paired student t test using Sigmaplot (SPSS, Chicago).
Figure 6
Figure 6
Chemokine-Triggered Ca2+ Mobilization. Intracellular Ca2+ mobilization was measured by stimulating Fura-2 loaded NIH3T3CD4CXCR4 (A) or NIH3T3CD4CCR5 (B) cells with chemokines SDF1-α (A) or MIP1-β (B) at different concentrations. The ratio of fluorescence at 340 and 380 nm was calculated using a FL Win Lab program (Perkin-Elmer). Left panel: untreated cells, middle panel: PPMP-treated cells; right panel: MβCD-treated cells.

Similar articles

Cited by

References

    1. Gallo SA, Finnegan CM, Viard M, Raviv Y, Dimitrov A, Rawat SS, Puri A, Durell S, Blumenthal R. The HIV Env-mediated fusion reaction. Biochim Biophys Acta. 2003;1614:36–50. doi: 10.1016/S0005-2736(03)00161-5. - DOI - PubMed
    1. Kowalski M, Potz J, Basiripour L, Dorfman T, Goh WC, Terwilliger E, Dayton A, Rosen C, Haseltine W, Sodroski J. Functional regions of the envelope glycoprotein of human immunodeficiency virus type 1. Science. 1987;237:1351–1355. doi: 10.1126/science.3629244. - DOI - PubMed
    1. Moulard M, Decroly E. Maturation of HIV envelope glycoprotein precursors by cellular endoproteases. Biochim Biophys Acta. 2000;1469:121–132. - PubMed
    1. Center RJ, Leapman RD, Lebowitz J, Arthur LO, Earl PL, Moss B. Oligomeric Structure of the Human Immunodeficiency Virus Type 1 Envelope Protein on the Virion Surface. J Virol. 2002;76:7863–7867. doi: 10.1128/JVI.76.15.7863-7867.2002. - DOI - PMC - PubMed
    1. Wyatt R, Sodroski J. The HIV-1 envelope glycoproteins: fusogens, antigens, and immunogens. Science. 1998;280:1884–1888. doi: 10.1126/science.280.5371.1884. - DOI - PubMed