Review
. 2006 Dec 22:5:127.
doi: 10.1186/1475-2875-5-127.

Some considerations in the design and interpretation of antimalarial drug trials in uncomplicated falciparum malaria

Affiliations
Review

Some considerations in the design and interpretation of antimalarial drug trials in uncomplicated falciparum malaria

Kasia Stepniewska et al. Malar J. .

Abstract

Background: Treatments for uncomplicated falciparum malaria should have high cure rates. The World Health Organization has recently set a target cure rate of 95% assessed at 28 days. The use of more effective drugs, with longer periods of patient follow-up, and parasite genotyping to distinguish recrudescence from reinfection raise issues related to the design and interpretation of antimalarial treatment trials in uncomplicated falciparum malaria which are discussed here.

Methods: The importance of adequate follow-up is presented and the advantages and disadvantages of non-inferiority trials are discussed. The different methods of interpreting trial results are described, and the difficulties created by loss to follow-up and missing or indeterminate genotyping results are reviewed.

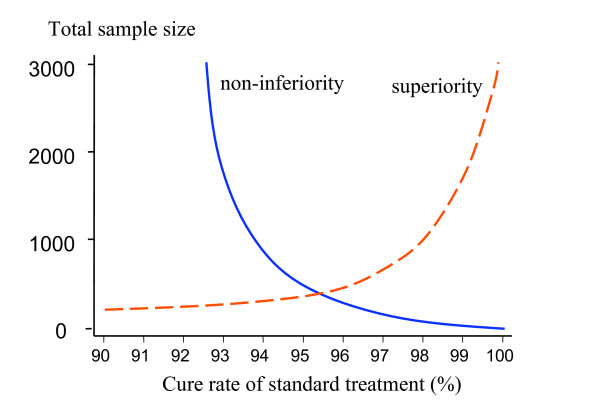
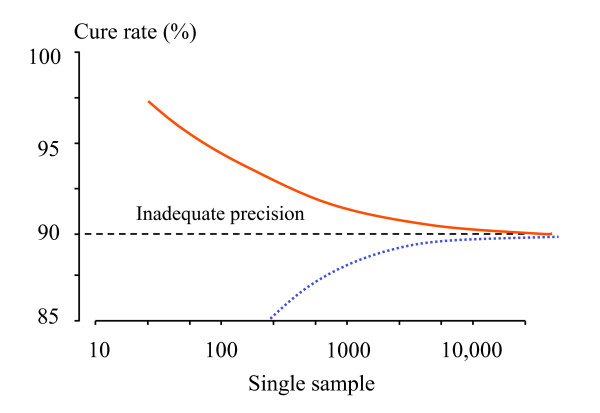
Conclusion: To characterize cure rates adequately assessment of antimalarial drug efficacy in uncomplicated malaria requires a minimum of 28 days and as much as 63 days follow-up after starting treatment. The longer the duration of follow-up in community-based assessments, the greater is the risk that this will be incomplete, and in endemic areas, the greater is the probability of reinfection. Recrudescence can be distinguished from reinfection using PCR genotyping but there are commonly missing or indeterminate results. There is no consensus on how these data should be analysed, and so a variety of approaches have been employed. It is argued that the correct approach to analysing antimalarial drug efficacy assessments is survival analysis, and patients with missing or indeterminate PCR results should either be censored from the analysis, or if there are sufficient data, results should be adjusted based on the identified ratio of new infections to recrudescences at the time of recurrent parasitaemia. Where the estimated cure rates with currently recommended treatments exceed 95%, individual comparisons with new regimens should generally be designed as non-inferiority trials with sample sizes sufficient to determine adequate precision of cure rate estimates (such that the lower 95% confidence interval bound exceeds 90%).


Figures

Figure 1
Figure 1
Comparison of the effects of trial drop-outs on estimated failure rates in 100 patients followed for 63 days after a treatment with a true 20% failure rate. The "per protocol" method (PP), of estimating cure rates in which the denominator at each time point is the combined number of patients who were followed until that point and continued to be aparasitaemic and those who had a recrudescence observed, is shown as a red solid line and compared with the Kaplan-Meier survival method. The drop-outs all occurred after 28 days of follow-up. Three different scenarios are presented with differing proportions of failures (20 in total) presenting before and after 28 days: blue dash line – 2 failures before and 18 after day 28; orange dash line – 10 failures before and 10 failures after day 28; green dash line – 18 failures before and 2 failures after day 28.
Figure 2
Figure 2
The upper limit of two sided 95% confidence intervals for single point estimates of failure rate for different sample sizes, estimated using Wilson's method, are shown as solid lines (upper left). The upper limit of two sided 95% confidence intervals for differences between the observed failure rate and a standard treatment with a failure rate of 5% for different sample sizes, estimated using Newcombe's method, are shown as dashed lines (lower right).
Figure 3
Figure 3
Degree of overestimation of the true failure rate provided by an ITT analysis where all patients failing to complete the trial satisfactorily are considered as "treatment failures". Overestimation is calculated as a ratio of estimated failure rate using the ITT approach to the true failure rate. When true cure rates are low (i.e. less than 10% – vertical dotted line) the overestimation is considerable.
Figure 4
Figure 4
a and b. Simulated example of a clinical trial evaluation of a slowly eliminated antimalarial drug (e.g. mefloquine) with a 23% failure rate evaluated in an area with high malaria transmission (EIR 12/year) (upper panel). The apparent failure rate based on genotyping at 4 weeks is 3% and at 6 weeks is 15%. All patients are eventually reinfected once the drug has been eliminated and the prophylactic effect exhausted. There is a non-linear relationship between recrudescences and reinfections. Figure 4b shows the proportion of recurrent infections that are recrudescences.
Figure 5
Figure 5
Operating within the confines of cure rates which should exceed 90%, and thus trials which must have the statistical power to exclude, with 95% confidence, that the cure rate of the new antimalarial does exceed this value, the relationship between sample size (y axis) and cure rate of the established treatment (x axis) is illustrated. For superiority trials with 2α= 0.05 and β = 0.2, the dashed line shows the lower limit of possible sample sizes; i.e. when the new treatment has an estimated efficacy of 100%. For non-inferiority trials the solid line shows the sample size required to ensure that the 95% CI for treatment efficacy of the new treatment exceeds 90%; i.e. the non-inferiority margin δ is (cure rate of the standard treatment-0.9), assuming that the true cure rates are the same. These assume 1:1 randomization.
Figure 6
Figure 6
The relationship between sample size (in a single sample) and precision in characterizing the cure rate is shown; the upper solid line shows the boundary for the cure rate below which the lower 95% confidence interval bound for the proportion falls below 90%, and the lower dotted line shows the boundary for the cure rate below which the upper 95% confidence interval bound for the proportion exceeds 90%. Sample sizes to the left of the curves provide inadequate precision if the objective is to be sure the confidence interval for the sample does not cross 90%.

References

    1. World Health Organization Guidelines for the treatment of malaria. 2006. WHO/HTM/MAL/2006.1108.
    1. Myint HY, Tipmanee P, Nosten F, Pukrittayakamee S, Day NPJ, Looareesuwan S, White NJ. A systematic overview of published antimalarial drug trials. Trans R Soc Trop Med Hyg. 2004;98:73–81. doi: 10.1016/S0035-9203(03)00014-2. - DOI - PubMed
    1. Simpson JA, Watkins ER, Price RN, Aarons L, Kyle DE, White NJ. Mefloquine pharmacokinetic-pharmacodynamic models: implications for dosing and resistance. Antimicrob Agents Chemother. 2000;44:3414–3424. doi: 10.1128/AAC.44.12.3414-3424.2000. - DOI - PMC - PubMed
    1. White NJ. Assessment of the pharmacodynamic properties of the antimalarial drugs in-vivo. Antimicrob Agents Chemother. 1997;41:1413–1422. - PMC - PubMed
    1. Shlaes DM, Moellering RC., Jr The United States Food and Drug Administration and the end of antibiotics. Clin Infect Dis. 2002;34:420–422. doi: 10.1086/338976. - DOI - PubMed

Publication types

MeSH terms