. 2007 Feb 1;361(1):31-46.
doi: 10.1016/j.ab.2006.10.042. Epub 2006 Nov 16.

Transchip: single-molecule detection of transcriptional elongation complexes

Affiliations

Transchip: single-molecule detection of transcriptional elongation complexes

Tian Wu et al. Anal Biochem. .

Abstract

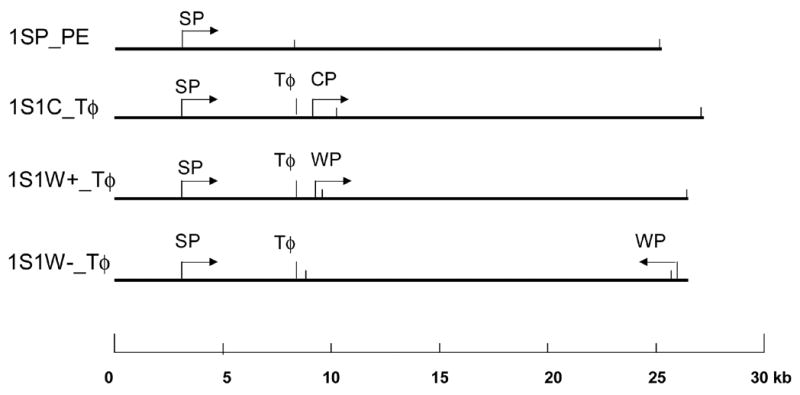
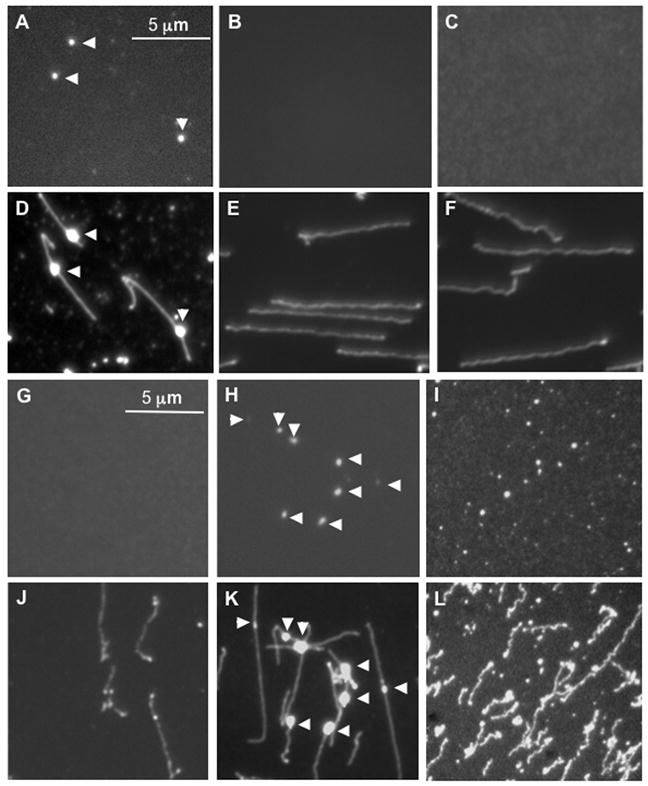
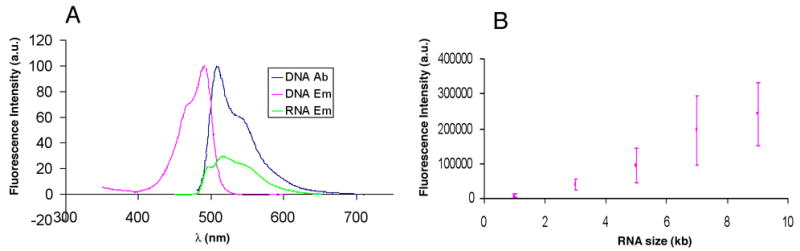
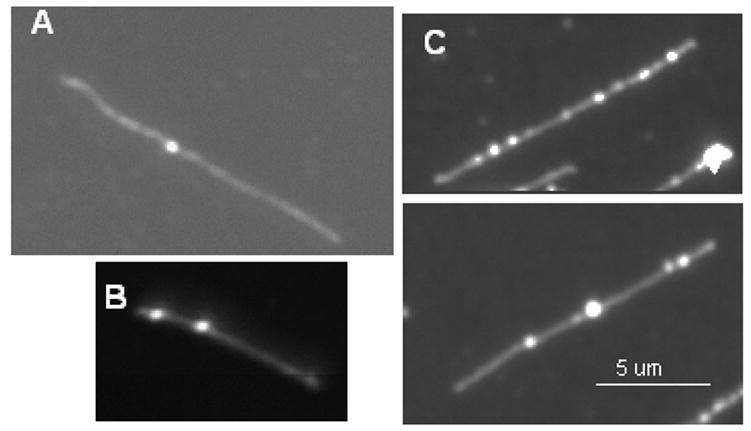
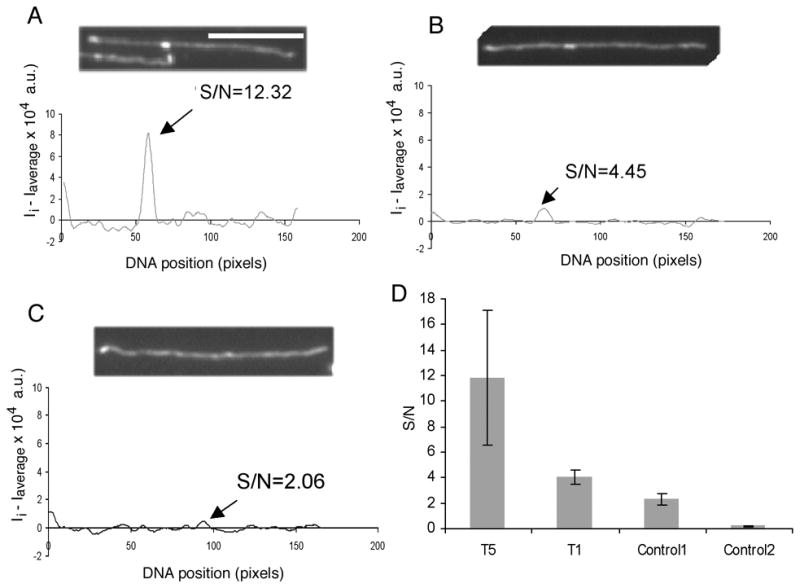
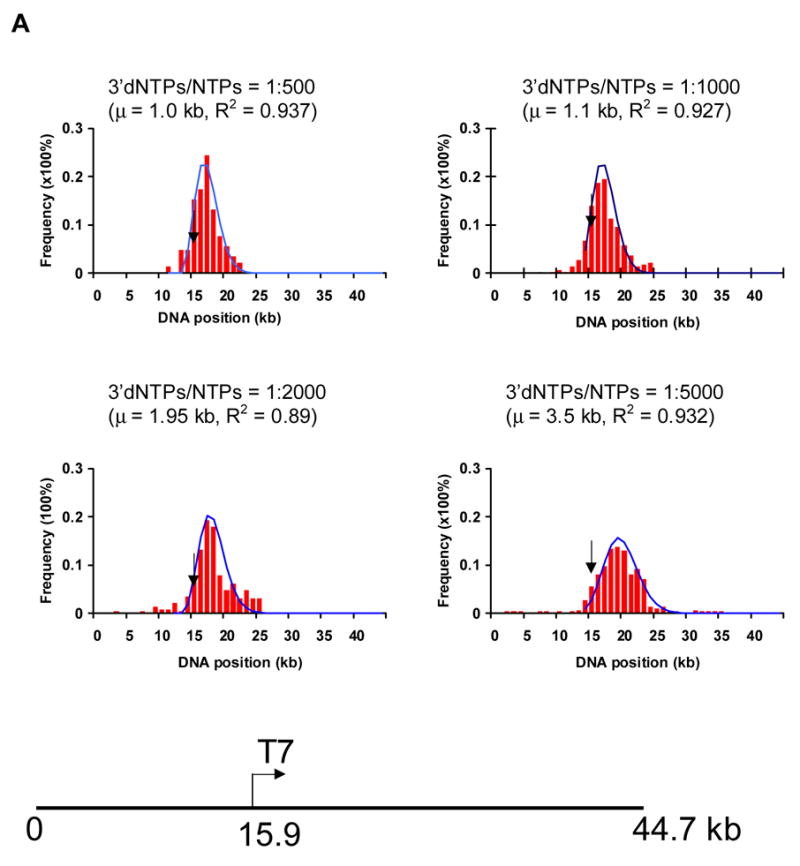
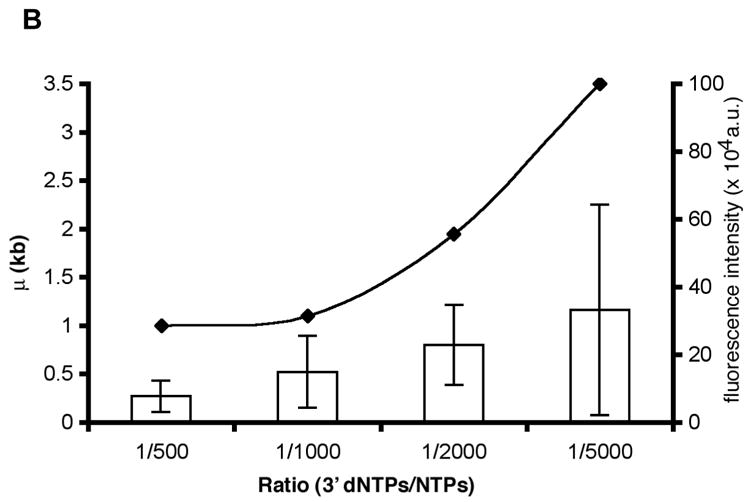
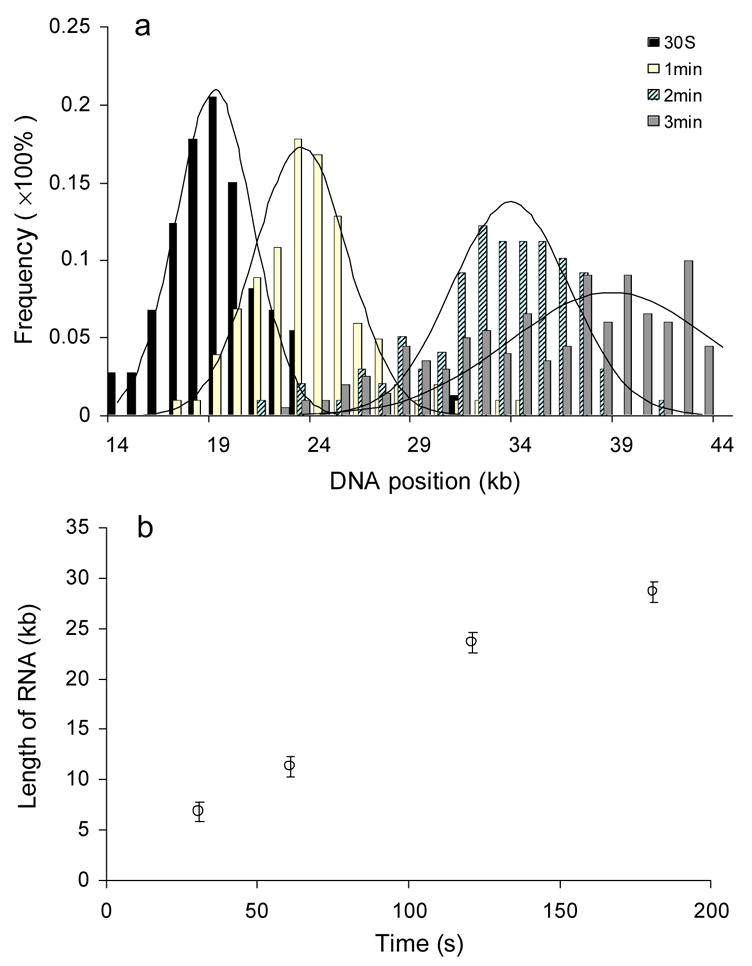
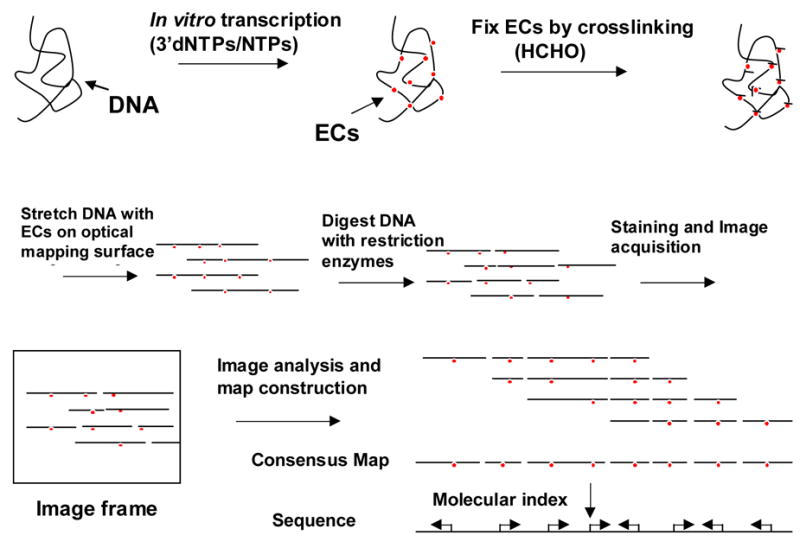
A new single-molecule system, Transchip, was developed for analysis of transcription products at their genomic origins. The bacteriophage T7 RNA polymerase and its promoters were used in a model system, and resultant RNAs were imaged and detected at their positions along single template DNA molecules. The Transchip system has drawn from critical aspects of Optical Mapping, a single-molecule system that enables the construction of high-resolution ordered restriction maps of whole genomes from single DNA molecules. Through statistical analysis of hundreds of single-molecule template/transcript complexes, Transchip enables analysis of the locations and strength of promoters, the direction and processivity of transcription reactions, and the termination of transcription. These novel results suggest that the new system may serve as a high-throughput platform to investigate transcriptional events on a large genome-wide scale.


Figures

Fig. 1
Fig. 1
Diagram of plasmids - 1SP_PE, 1S1C_Tφ, 1S1W+_Tφ, and 1S1W-_Tφ - constructed with one or more of the following transcription elements: a synthetic T7 promoter, SP; a consensus T7 promoter, CP; a T7 class II promoter, WP; and a terminator (Tφ). The arrows show the direction of transcription. The short, vertical bars represent BamH I cleavage sites. The scale bar (bottom) is in kb.
Fig. 2
Fig. 2
Identification and localization of fluorescently labeled transcripts on DNA template LANL-16c_380H5. In vitro transcription reactions were conducted and mounted on APDEMS OM surfaces, as described. A–C and G–I) Images were taken using XF-102 filter, which is suitable for TMR-6-UTP labeled RNA. A) In vitro transcription with T7 RNA polymerase, NTPs and TMR-6-UTP. B) Control transcription reaction, lacking NTPs. C) Control reaction, lacking T7 RNA polymerase). D–F) These images correspond to those of A–C, taken using a YOYO-1 filter following staining with YOYO-1. Elongation complexes were digested with RNase I (G) or with RNase H (H), or with proteinase K (I) on the surface. J–L) These images correspond to those of G–I, following staining with YOYO-1. The surfaces were APDEMS surfaces (see Materials and Methods).
Fig. 3
Fig. 3
Analysis of YOYO-1 stained RNA. A) Comparison of spectrum of YOYO-1 stained DNA (DNA Em) with YOYO-1 stained RNA (RNA Em) excited by the maximum absorption wavelength for DNA (DNA Ab) 491 nm. B) Scatter plot of the mean integrated fluorescence intensity of single RNA molecules mounted on Optical Mapping surfaces (APDEMS), with error bars indicating the standard deviation. Acquisition time: 5000 ms; number of analyzed molecules: 100 to ~200 for each measurement; light power: ~ 1mW. The RNAs were diluted to an appropriate concentration (~ 50 pg/ml) before they were mounted on the surface.
Fig. 4
Fig. 4
Transcription reactions with template DNAs bearing one (A), two (B) or multiple (C) T7 promoters were surface-mounted (on trimethyl surfaces) and stained with YOYO-1. A) Representative image from a reaction supported by the cosmid LANL-16c_380H5, a 44.675 kb template with one promoter 16 kb from one end. B) Representative image from a reaction supported by 1S1C_Tφ, which is 27.212 kb and has two promoters at 3.675 kb and 9.665 kb from one end. C) Representative images from a reaction supported by T7 genomic DNA, which is 39.937 kb and has 17 promoters. All template DNAs were linearized prior to transcription.
Fig. 5
Fig. 5
Fluorescence intensity profiles of single DNA molecules following transcription supported by cosmid LANL-16c_380H5 (at 20 ng/μl) with a punctate from transcription with 5 units of T7 RNAP, T5 (A), an EC from a single round with 1 unit of T7 RNAP, T1 (B) and no EC (C). The molecule analyzed in each of the panels (A), (B) and (C) is the top one in the image. The X coordinate represents the DNA length in pixels and the Y coordinate represents the normalized fluorescence intensity of each pixel along the DNA backbone. The arrows point to the pixel in the plot with the maximum intensity on the DNA backbone, labeled with the ratio of S/N (signal to noise). The white bar in the image represents 5 μm. D) The bar graph shows S/N levels for a punctate with multiple RNAs (T5, from a reaction with 5 units of T7 RNAP); for a punctate from a reaction T1, with 1 unit of T7 RNAP and heparin (both with a 3′dNTP:NTP ratio of 1:2000); pixels with maximum intensity on control DNA molecules (control 1), and every pixel on control DNA molecules (control 2). Each bar is calculated from 20 molecules, and error bars show the standard deviation.
Fig. 6
Fig. 6
Assessment of positions of ECs along single template molecules in transcription reactions conducted at decreasing levels of 3′ dNTPs. A) The histograms show the distribution of ECs on the linear cosmid DNA (LANL-16c_380H5) from reactions conducted with ratios of 1:500, 1:1000, 1:2000 and 1:5000 of 3′dNTPs to NTPs. The arrow in each histogram indicates the location of the T7 promoter (at 15.9 kb; see diagram of LANL-16c_380H5 below). The frequency of the distribution of ECs is normalized with respect to the total number of ECs analyzed for each histogram. (Approximately 100 to 200 ECs were analyzed for each histogram.) The smooth curves represent fits to a Poisson, with regression fit (R2) and calculated mean value (μ) shown for each graph. μ corresponds to the average distance of ECs downstream of the promoter. B) The ratio of 3′dNTPs/NTPs is plotted vs μ (kb) and vs. the average integrated fluorescence intensity of ECs. The average distance of ECs downstream from the promoter (μ) increases with decreasing ratios of 3′dNTPs/NTPs. Error bars in the bar graph were calculated as the standard deviation on sets of ECs. (138, 100, 92 and 123 measurements were made for reactions conducted at 1:500, 1:1000, 1:2000 and 1:5000 ratios of 3′dNTPs/NTPs, respectively.) The integrated fluorescence intensity was calculated for each stalled EC. The arbitrary units represent the grey value from pixels of ECs.
Fig. 6
Fig. 6
Assessment of positions of ECs along single template molecules in transcription reactions conducted at decreasing levels of 3′ dNTPs. A) The histograms show the distribution of ECs on the linear cosmid DNA (LANL-16c_380H5) from reactions conducted with ratios of 1:500, 1:1000, 1:2000 and 1:5000 of 3′dNTPs to NTPs. The arrow in each histogram indicates the location of the T7 promoter (at 15.9 kb; see diagram of LANL-16c_380H5 below). The frequency of the distribution of ECs is normalized with respect to the total number of ECs analyzed for each histogram. (Approximately 100 to 200 ECs were analyzed for each histogram.) The smooth curves represent fits to a Poisson, with regression fit (R2) and calculated mean value (μ) shown for each graph. μ corresponds to the average distance of ECs downstream of the promoter. B) The ratio of 3′dNTPs/NTPs is plotted vs μ (kb) and vs. the average integrated fluorescence intensity of ECs. The average distance of ECs downstream from the promoter (μ) increases with decreasing ratios of 3′dNTPs/NTPs. Error bars in the bar graph were calculated as the standard deviation on sets of ECs. (138, 100, 92 and 123 measurements were made for reactions conducted at 1:500, 1:1000, 1:2000 and 1:5000 ratios of 3′dNTPs/NTPs, respectively.) The integrated fluorescence intensity was calculated for each stalled EC. The arbitrary units represent the grey value from pixels of ECs.
Fig. 7
Fig. 7
Localization of promoters on the template DNAs 1SP_PE, 1S1C_Tφ, 1S1W+_Tφ, and 1S1W-_Tφ. A) Representative images of surface-mounted transcription reactions supported by 1SP_PE, 1S1C_Tφ, 1S1W+_Tφ, and 1S1W-_Tφ. Yellow arrows point to prominent ECs, and blue arrows to BamH I restriction sites. The two discernible BamH I fragments are 8.3 and 16.8 kb for 1SP_PE; 10.3 and 16.8 (1S1C_Tφ); 9.6 and 16.8 (1S1W+_Tφ), and 8.9 and 16.8 (1S1W-Tφ). (White bar: 5 μm). B) Histograms show the distributions of ECs on template DNAs at ratios of 3′dNTP to NTP of 1:1000. The solid plots are the Poisson curve fits with shown regression fit (R2) and calculated mean value (μ) for each graph. (100–200 molecules were analyzed for each graph.)
Fig. 8
Fig. 8
Analysis of the processivity of T7 RNA polymerase and its elongation rate. A) The distribution of positions of ECs on the template cosmid LANL-16c_380H5 is shown for single-round transcription reactions conducted for 30 sec, 1 min, 2 min and 3 min. The frequency of ECs is normalized with respect to the total number of measurements (73, 101, 98 and 199 measurements were included, respectively, for the 30 sec, 1 min, 2 min and 3 min time points). The X coordinate starts at the 14 kb position, since the promoter is at 15.9 kb. The solid plots are the Gaussian curve fit (analyzed using Origin software). The R2 values of regression fit are respectively 0.98 (30 sec), 0.94 (1 min), 0.92 (2 min) and 0.81 (3 min). Reactions were 20 ng/μl in template DNA and contained 50 units of T7 RNAP. They were preincubated 10 min before addition of NTPs and heparin (to 100 μg/mL). (B) The plot shows the estimated length of RNAs at different time points.
Fig. 9
Fig. 9
Analysis of genome-wide transcription products at the single molecule basis. For Transchip analysis across a genome, single genomic template DNAs are transcribed with the appropriate RNA polymerase and factors at different ratios of 3′dNTPs to NTPs. Elongation complexes are fixed to genomic DNA by crosslinking with formaldehyde (HCHO) prior to the mounting and elongation of the reaction products on Optical Mapping surfaces. Following restriction enzyme digestion of surface-mounted template molecules, the template molecules with associated elongation complexes (ECs) are stained with fluorescent dye, imaged, and positions of ECs determined. Molecular barcodes (single molecule restriction maps) are used to index individual DNA molecules to the consensus map or in silico map of the genome constructed from sequence. Aligned molecules and positions and directionality of promoters determined from Transchip analysis are used to construct an in vitro transcription profile for the whole genome.

References

    1. Schafer DA, Gelles J, Sheetz MP, Landick R. Transcription by single molecules of RNA polymerase observed by light microscopy. Nature. 1991;352:444–448. - PubMed
    1. Kasas S, Thomson NH, Smith BL, Hansma HG, Zhu X, Guthold M, Bustamante C, Kool ET, Kashlev M, Hansma PK. Escherichia coli RNA polymerase activity observed using atomic force microscopy. Biochemistry. 1997;36:461–468. - PubMed
    1. Rich A. The rise of single-molecule DNA biochemistry. Proc Natl Acad Sci USA. 1998;95:13999–14000. - PMC - PubMed
    1. Rivetti C, Guthold M, Bustamante C. Wrapping of DNA around the E. coli RNA polymerase open promoter complex. EMBO Journal. 1999;18:4464–4475. - PMC - PubMed
    1. Wang MD, Schnitzer MJ, Yin H, Landick R, Gelles J, Block SM. Force and velocity measured for single molecules of RNA polymerase. Science. 1998;282:902–907. - PubMed

Publication types

Substances

LinkOut - more resources