

Requirements for prediction of peptide retention time in reversed-phase high-performance liquid chromatography: hydrophilicity/hydrophobicity of side-chains at the N- and C-termini of peptides are dramatically affected by the end-groups and location
- PMID: 17187811
- PMCID: PMC2722105
- DOI: 10.1016/j.chroma.2006.12.024
Requirements for prediction of peptide retention time in reversed-phase high-performance liquid chromatography: hydrophilicity/hydrophobicity of side-chains at the N- and C-termini of peptides are dramatically affected by the end-groups and location
Abstract
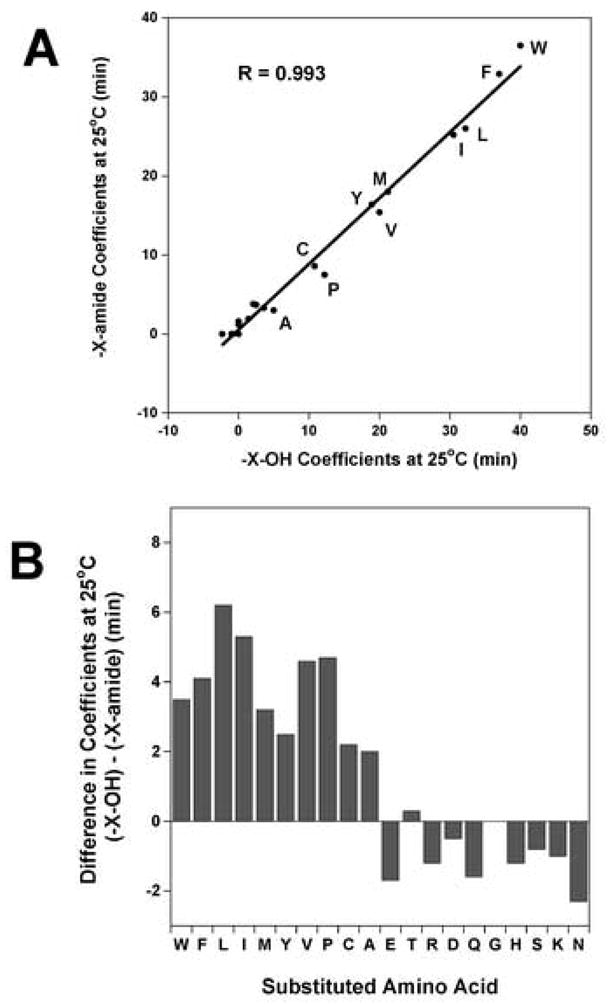
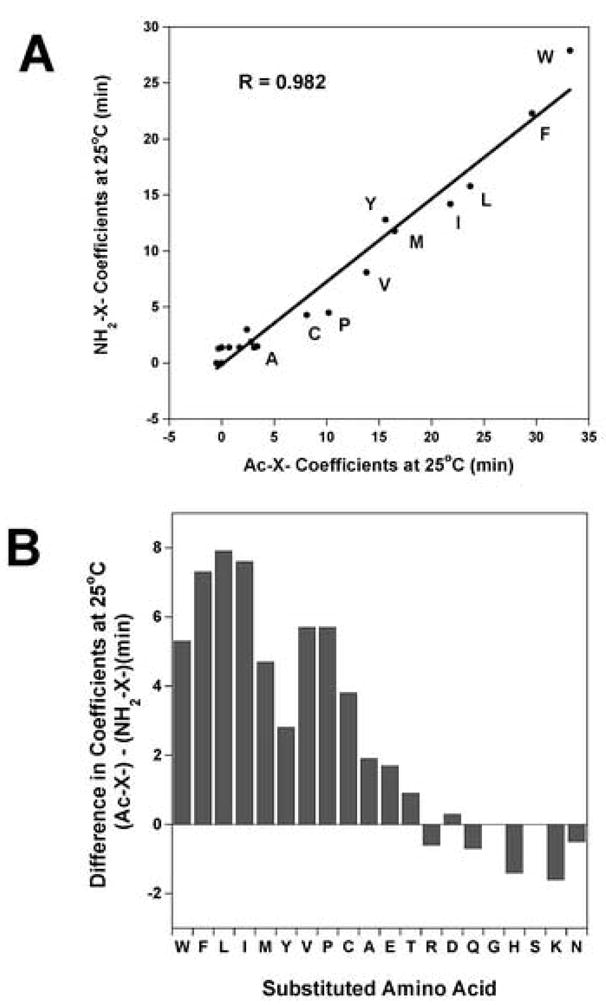
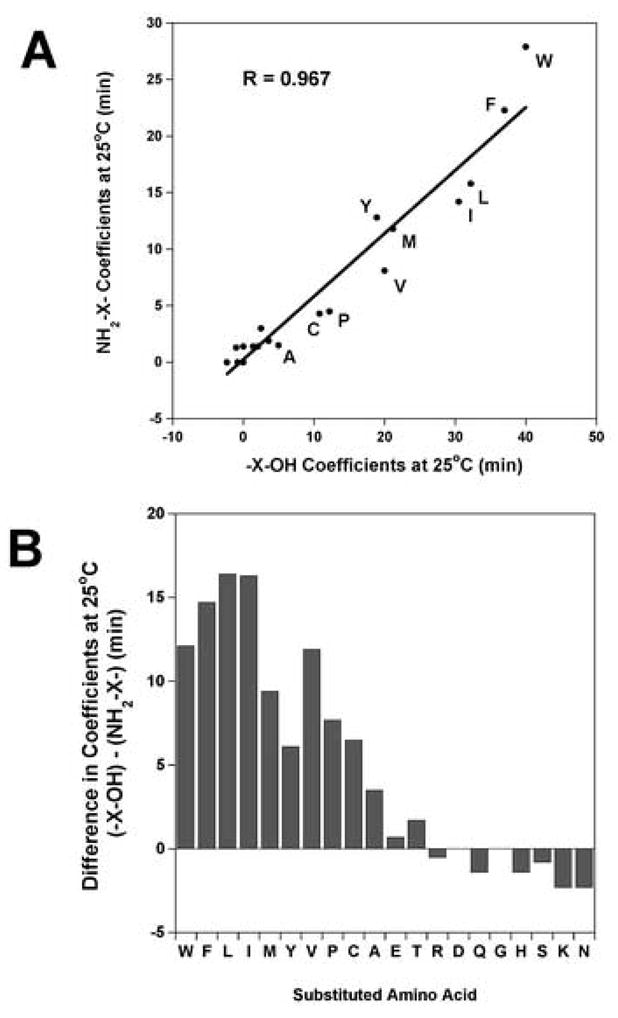
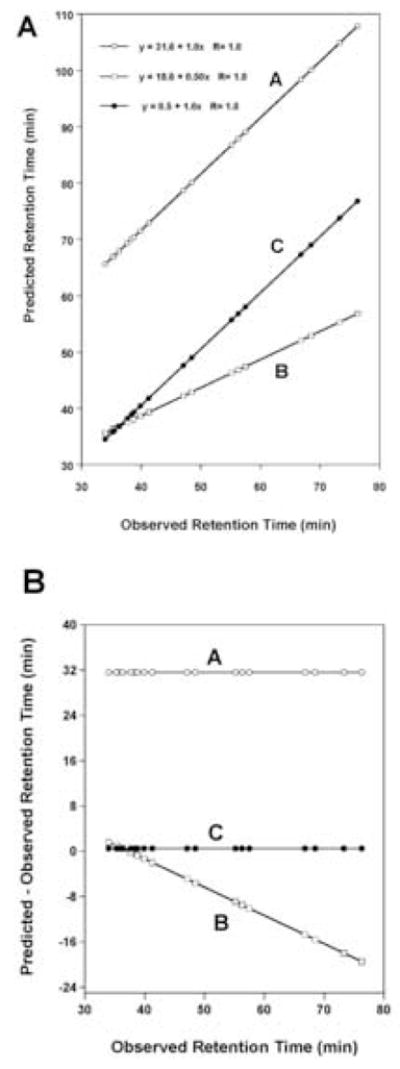
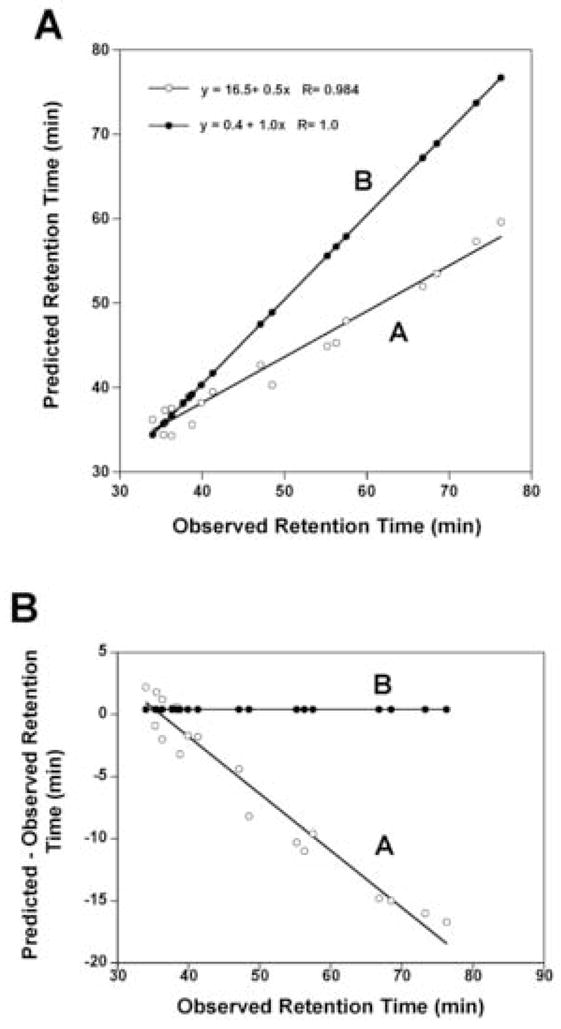
The value of reversed-phase high-performance liquid chromatography (RP-HPLC) and the field of proteomics would be greatly enhanced by accurate prediction of retention times of peptides of known composition. The present study investigates the hydrophilicity/hydrophobicity of amino acid side-chains at the N- and C-termini of peptides while varying the functional end-groups at the termini. We substituted all 20 naturally occurring amino acids at the N- and C-termini of a model peptide sequence, where the functional end-groups were N(alpha)-acetyl-X- and N(alpha)-amino-X- at the N-terminus and -X-C(alpha)-carboxyl and -X-C(alpha)-amide at the C-terminus. Amino acid coefficients were subsequently derived from the RP-HPLC retention behaviour of these peptides and compared to each other as well as to coefficients determined in the centre of the peptide chain (internal coefficients). Coefficients generated from residues substituted at the C-terminus differed most (between the -X-C(alpha)-carboxyl and -X-C(alpha)-amide peptide series) for hydrophobic side-chains. A similar result was seen for the N(alpha)-acetyl-X- and N(alpha)-amino-X- peptide series, where the largest differences in coefficient values were observed for hydrophobic side-chains. Coefficients derived from substitutions at the C-terminus for hydrophobic amino acids were dramatically different compared to internal coefficients for hydrophobic side-chains, ranging from 17.1 min for Trp to 4.8 min for Cys. In contrast, coefficients derived from substitutions at the N-terminus showed relatively small differences from the internal coefficients. Subsequent prediction of peptide retention time, within an error of just 0.4 min, was achieved by a predictive algorithm using a combination of internal coefficients and coefficients for the C-terminal residues. For prediction of peptide retention time, the sum of the coefficients must include internal and terminal coefficients.
Figures

Similar articles
-
Intrinsic amino acid side-chain hydrophilicity/hydrophobicity coefficients determined by reversed-phase high-performance liquid chromatography of model peptides: comparison with other hydrophilicity/hydrophobicity scales.Biopolymers. 2009;92(6):573-95. doi: 10.1002/bip.21316. Biopolymers. 2009. PMID: 19795449 Free PMC article. Review.
-
Context-dependent effects on the hydrophilicity/hydrophobicity of side-chains during reversed-phase high-performance liquid chromatography: Implications for prediction of peptide retention behaviour.J Chromatogr A. 2006 Sep 1;1125(2):211-9. doi: 10.1016/j.chroma.2006.05.063. Epub 2006 Jun 30. J Chromatogr A. 2006. PMID: 16814308 Free PMC article.
-
Reversed-phase chromatography of synthetic amphipathic alpha-helical peptides as a model for ligand/receptor interactions. Effect of changing hydrophobic environment on the relative hydrophilicity/hydrophobicity of amino acid side-chains.J Chromatogr A. 1994 Jul 29;676(1):139-53. doi: 10.1016/0021-9673(94)00371-8. J Chromatogr A. 1994. PMID: 7921171
-
Determination of intrinsic hydrophilicity/hydrophobicity of amino acid side chains in peptides in the absence of nearest-neighbor or conformational effects.Biopolymers. 2006;84(3):283-97. doi: 10.1002/bip.20417. Biopolymers. 2006. PMID: 16315143 Free PMC article.
-
Predictions of peptides' retention times in reversed-phase liquid chromatography as a new supportive tool to improve protein identification in proteomics.Proteomics. 2009 Feb;9(4):835-47. doi: 10.1002/pmic.200800544. Proteomics. 2009. PMID: 19160394 Review.
Cited by
-
Calorimetric Analysis of the Interplay between Synthetic Tn Antigen-Presenting MUC1 Glycopeptides and Human Macrophage Galactose-Type Lectin.Biochemistry. 2021 Feb 23;60(7):547-558. doi: 10.1021/acs.biochem.0c00942. Epub 2021 Feb 9. Biochemistry. 2021. PMID: 33560106 Free PMC article.
-
Influence of Lipidation Pattern of the KR12 Fragment of Peptide LL-37 on Its Antibacterial and Hemolytic Activities.Int J Mol Sci. 2023 Mar 13;24(6):5505. doi: 10.3390/ijms24065505. Int J Mol Sci. 2023. PMID: 36982579 Free PMC article.
-
D- and Unnatural Amino Acid Substituted Antimicrobial Peptides With Improved Proteolytic Resistance and Their Proteolytic Degradation Characteristics.Front Microbiol. 2020 Nov 12;11:563030. doi: 10.3389/fmicb.2020.563030. eCollection 2020. Front Microbiol. 2020. PMID: 33281761 Free PMC article.
-
Retro analog concept: comparative study on physico-chemical and biological properties of selected antimicrobial peptides.Amino Acids. 2017 Oct;49(10):1755-1771. doi: 10.1007/s00726-017-2473-7. Epub 2017 Jul 29. Amino Acids. 2017. PMID: 28756544 Free PMC article.
-
Phosphopeptide elution times in reversed-phase liquid chromatography.J Chromatogr A. 2007 Nov 16;1172(1):9-18. doi: 10.1016/j.chroma.2007.09.032. Epub 2007 Sep 18. J Chromatogr A. 2007. PMID: 17935722 Free PMC article.
References
-
- Petritis K, Kangas LJ, Ferguson PL, Anderson GA, Paša-Tolić L, Lipton MS, Auberry KJ, Strittmatter EF, Shen Y, Zhao R, Smith RD. Anal Chem. 2003;75:1039. - PubMed
-
- Biswas KM, DeVido DR, Dorsey JG. J Chromatogr A. 2003;1000:637. - PubMed
-
- Meek JL, Rossetti ZL. J Chromatogr. 1981;211:15.
-
- Su SJ, Grego B, Niven B, Hearn MTW. J Liq Chromatogr. 1981;4:1745.
Publication types
MeSH terms
Substances
Grants and funding
LinkOut - more resources
Full Text Sources
