

NMR analysis of the conformational properties of the trapped on-pathway folding intermediate of the bacterial immunity protein Im7
- PMID: 17188712
- PMCID: PMC2706327
- DOI: 10.1016/j.jmb.2006.11.012
NMR analysis of the conformational properties of the trapped on-pathway folding intermediate of the bacterial immunity protein Im7
Abstract
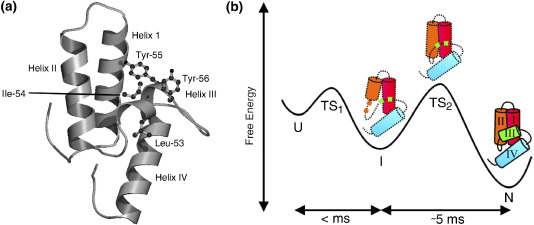
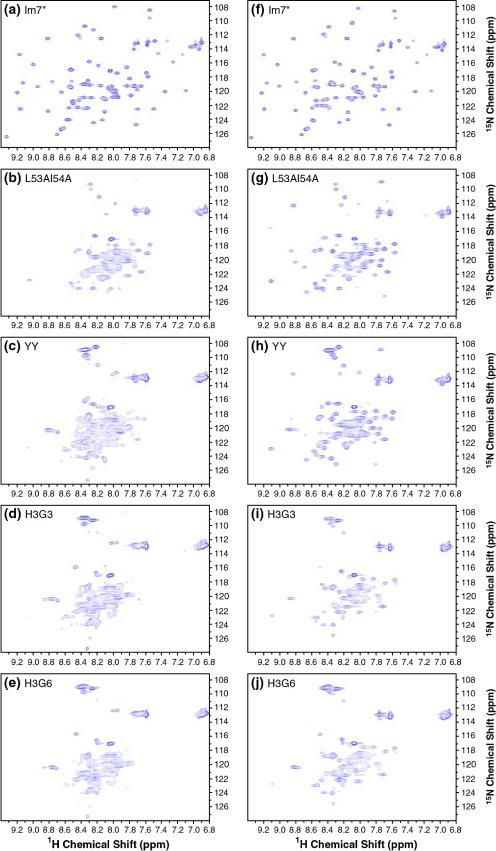
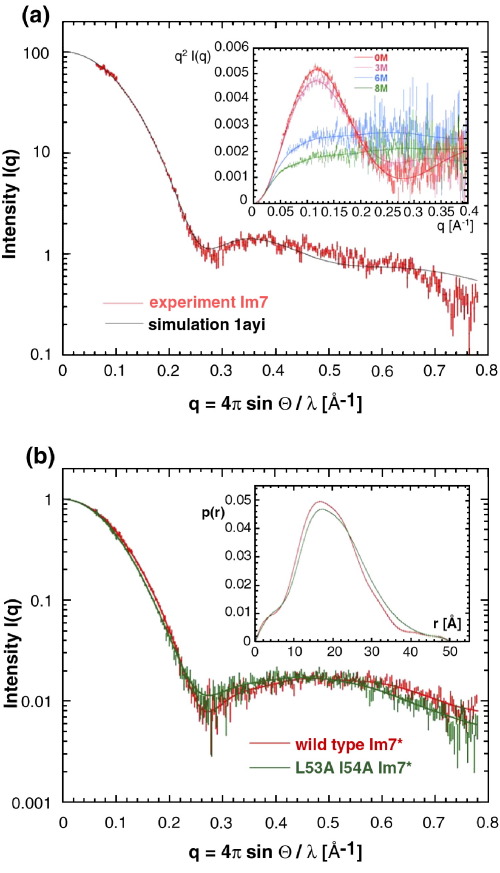
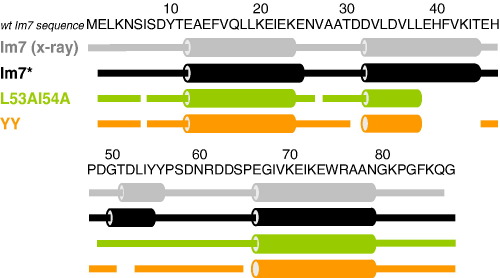
Previous work shows that the transiently populated, on-pathway intermediate in Im7 folding contains three of the four native alpha-helices docked around a core stabilised by native and non-native interactions. To determine the structure and dynamic properties of this species in more detail, we have used protein engineering to trap the intermediate at equilibrium and analysed the resulting proteins using NMR spectroscopy and small angle X-ray scattering. Four variants were created. In L53AI54A, two hydrophobic residues within helix III are truncated, preventing helix III from docking stably onto the developing hydrophobic core. In two other variants, the six residues encompassing the native helix III were replaced with three (H3G3) or six (H3G6) glycine residues. In the fourth variant, YY, two native tyrosine residues (Tyr55 and Tyr56) were re-introduced into H3G6 to examine their role in determining the properties of the intermediate ensemble. All four variants show variable peak intensities and broad peak widths, consistent with these proteins being conformationally dynamic. Chemical shift analyses demonstrated that L53AI54A and YY contain native-like secondary structure in helices I and IV, while helix II is partly formed and helix III is absent. Lack of NOEs and rapid NH exchange for L53AI54A, combined with detailed analysis of the backbone dynamics, indicated that the hydrophobic core of this variant is not uniquely structured, but fluctuates on the NMR timescale. The results demonstrate that though much of the native-like secondary structure of Im7 is present in the variants, their hydrophobic cores remain relatively fluid. The comparison of H3G3/H3G6 and L53AI54A/YY suggests that Tyr55 and/or Tyr56 interact with the three-helix core, leading other residues in this region of the protein to dock with the core as folding progresses. In this respect, the three-helix bundle acts as a template for formation of helix III and the creation of the native fold.
Figures
Similar articles
-
Trapping the on-pathway folding intermediate of Im7 at equilibrium.J Mol Biol. 2004 Jul 30;341(1):215-26. doi: 10.1016/j.jmb.2004.05.049. J Mol Biol. 2004. PMID: 15312774
-
Amino acid insertion reveals a necessary three-helical intermediate in the folding pathway of the colicin E7 immunity protein Im7.J Mol Biol. 2009 Oct 2;392(4):1074-86. doi: 10.1016/j.jmb.2009.07.085. Epub 2009 Aug 3. J Mol Biol. 2009. PMID: 19651139 Free PMC article.
-
Characterisation of the conformational properties of urea-unfolded Im7: implications for the early stages of protein folding.J Mol Biol. 2006 Dec 8;364(4):824-35. doi: 10.1016/j.jmb.2006.09.037. Epub 2006 Sep 16. J Mol Biol. 2006. PMID: 17045607
-
Understanding how small helical proteins fold: conformational dynamics of Im proteins relevant to their folding landscapes.Biochem Soc Trans. 2012 Apr;40(2):424-8. doi: 10.1042/BST20110739. Biochem Soc Trans. 2012. PMID: 22435824 Review.
-
Folding of apomyoglobin: Analysis of transient intermediate structure during refolding using quick hydrogen deuterium exchange and NMR.Proc Jpn Acad Ser B Phys Biol Sci. 2017;93(1):10-27. doi: 10.2183/pjab.93.002. Proc Jpn Acad Ser B Phys Biol Sci. 2017. PMID: 28077807 Free PMC article. Review.
Cited by
-
A combinatorial NMR and EPR approach for evaluating the structural ensemble of partially folded proteins.J Am Chem Soc. 2010 Jun 30;132(25):8657-68. doi: 10.1021/ja100646t. J Am Chem Soc. 2010. PMID: 20524659 Free PMC article.
-
NMR spectroscopy brings invisible protein states into focus.Nat Chem Biol. 2009 Nov;5(11):808-14. doi: 10.1038/nchembio.238. Nat Chem Biol. 2009. PMID: 19841630 Review.
-
Single-molecule studies of the Im7 folding landscape.J Mol Biol. 2010 Apr 23;398(1):132-45. doi: 10.1016/j.jmb.2010.02.048. Epub 2010 Mar 6. J Mol Biol. 2010. PMID: 20211187 Free PMC article.
-
Malleability of folding intermediates in the homeodomain superfamily.Proc Natl Acad Sci U S A. 2011 Apr 5;108(14):5596-601. doi: 10.1073/pnas.1101752108. Epub 2011 Mar 21. Proc Natl Acad Sci U S A. 2011. PMID: 21422286 Free PMC article.
-
Using hydroxyl radical footprinting to explore the free energy landscape of protein folding.Methods. 2015 Nov 1;89:38-44. doi: 10.1016/j.ymeth.2015.02.018. Epub 2015 Mar 5. Methods. 2015. PMID: 25746386 Free PMC article.
References
-
- Jackson S.E. How do small single-domain proteins fold? Fold. Des. 1998;3:R81–R91. - PubMed
-
- Grantcharova V., Alm E.J., Baker D., Horwich A.L. Mechanisms of protein folding. Curr. Opin. Struct. Biol. 2001;11:70–82. - PubMed
-
- Daggett V., Fersht A.R. Is there a unifying mechanism for protein folding? TIBS. 2003;28:18–25. - PubMed
-
- Capaldi A.P., Shastry M.C.R., Kleanthous C., Roder H., Radford S.E. Ultrarapid mixing experiments reveal that Im7 folds via an on-pathway intermediate. Nature Struct. Biol. 2001;8:68–72. - PubMed
Publication types
MeSH terms
Substances
Grants and funding
LinkOut - more resources
Full Text Sources
