. 2007 Feb 23;282(8):5296-301.
doi: 10.1074/jbc.M609343200. Epub 2006 Dec 21.

Fast and selective ammonia transport by aquaporin-8

Affiliations

Fast and selective ammonia transport by aquaporin-8

Sapar M Saparov et al. J Biol Chem. .

Abstract

The transport of ammonia/ammonium is fundamental to nitrogen metabolism in all forms of life. So far, no clear picture has emerged as to whether a protein channel is capable of transporting exclusively neutral NH(3) while excluding H(+) and NH(4)(+). Our research is the first stoichiometric study to show the selective transport of NH(3) by a membrane channel. The purified water channel protein aquaporin-8 was reconstituted into planar bilayers, and the exclusion of NH(4)(+) or H(+) was established by ensuring a lack of current under voltage clamp conditions. The single channel water permeability coefficient of 1.2 x 10(-14) cm(3)/subunit/s was established by imposing an osmotic gradient across reconstituted planar bilayers, and resulting minute changes in ionic concentration close to the membrane surface were detected. It is more than 2-fold smaller than the single channel ammonia permeability (2.7 x 10(-14) cm(3)/subunit/s) that was derived by establishing a transmembrane ammonium concentration gradient and measuring the resulting concentration increases adjacent to the membrane. This permeability ratio suggests that electrically silent ammonia transport may be the main function of AQP8.


Figures

FIGURE 1
FIGURE 1. Water transport by AQP8
Reconstitution of AQP8 (protein:lipid = 1:100) augmented water permeability of bare lipid bilayers (cholesterol:E. coli lipid extract:sphingomyelin = 3:2:1) from 11 to 27 μm/s. Water permeability was calculated from the dilution of Na+ ions shown as a function of the distance to the membrane. Osmotic water flux was induced by 1 m urea. The buffer contained 20 mm MES, 100 mm NaCl, 1 mm NH4Cl, pH 6.0.
FIGURE 2
FIGURE 2. Exclusion of NH4+ transport by AQP8
The current voltage characteristics of bare lipid bilayers and bilayers reconstituted with AQP8 are not altered by the hundredfold augmentation of the NH4Cl bulk concentration. A voltage ramp (duration 3 min) was applied in the interval from −90 to +90 mV. The current was measured with a frequency of 100 Hz and than filtered at 0.3 Hz (compare “Experimental Procedures”). The resulting data cloud is plotted. The spline lines were obtained by applying a local smoothing technique (100 intervals) using polynomial regression and weights computed from the Gaussian density function (SigmaPlot). The similarity of their slopes indicates that AQP8 excludes other ions as well. Membrane and buffer composition were as in Fig. 1.
FIGURE 3
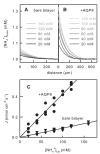
FIGURE 3. NH3 flux J as a function of the transmembrane NH4Cl concentration gradient
The NH4+ concentration in the trans compartment was measured by scanning microelectrodes as a function of the distance to the membrane. A, representative concentration profiles visualizing NH3 diffusion through a bare lipid bilayer made of a lipid mixture (cholesterol:E. coli lipid extract:sphingomyelin = 3:2:1). B, representative concentration profiles showing NH3 diffusion through reconstituted AQP8. For membrane formation the same lipid composition as in panel A was used. The protein:lipid ratio was 1:50. C, NH3 flux at different NH4+ bulk concentrations in the cis compartment. JNH3 and PNH3 were calculated using the analytical model of weak base diffusion (Equations 1-3 and Reactions 1 and 2). The regression lines correspond to NH3 permeabilities of 16 and 105 μm/s for bare and AQP8-containing bilayers, respectively. The buffer solution contained 20 mm MES, 100 mm NaCl, pH 6.0. The trans compartment contained 1 mm NH4Cl.
FIGURE 4
FIGURE 4. Inhibition of AQP8 mediated NH3 transport by Hg2+
Reconstitution of AQP8 in a protein:lipid ratio of 1:120 resulted in a NH3 permeability of 50μm/s. 1 mm Hg2+ reduced the permeability to that of a bare bilayer (here to 15 μm/s). The corresponding transmembrane NH3 fluxes were 0.2 and 0.06 nmol cm−2 s−1 in the absence and presence of Hg2+, respectively. The trans and cis NH4Cl concentrations in the bulk were equal to 1 and 80 mm, respectively. Buffer composition was as in Fig. 1.
FIGURE 5
FIGURE 5. NH3 membrane permeablity as a function of AQP8 membrane abundance
The trans and cis NH4Cl concentrations in the bulk were equal to 1 and 80 mm, respectively. In the absence of the protein (spline line), a modest increase in the cis NH4+ concentration was observed in the immediate membrane vicinity. Upon reconstitution of AQP8, the augmentation of NH4+ concentration adjacent to the membrane became more pronounced. The more protein was reconstituted, the higher was the concentration polarization. The gray lines represent concentration profiles generated by the theoretical model of weak base diffusion (Equations 1-3 and Reactions 1 and 2). The PNH3M values used to calculate the theoretical curves are plotted in the inset as a function of the protein:lipid ratio. Buffer composition was as in Fig. 1.

References

    1. King LS, Kozono D, Agre P. Nat. Rev. Mol. Cell Biol. 2004;5:687–698. - PubMed
    1. Yasui M, Hazama A, Kwon TH, Nielsen S, Guggino WB, Agre P. Nature. 1999;402:184–187. - PubMed
    1. Calamita G, Ferri D, Gena P, Liquori GE, Cavalier A, Thomas D, Svelto M. J. Biol. Chem. 2005;280:17149–17153. - PubMed
    1. Yang B, Zhao D, Verkman AS. J. Biol. Chem. 2006;281:16202–16206. - PubMed
    1. Yang B, Song Y, Zhao D, Verkman AS. Am. J. Physiol. 2005;288:C1161–C1170. - PubMed

Publication types

LinkOut - more resources